Fig. 2.
Download original image
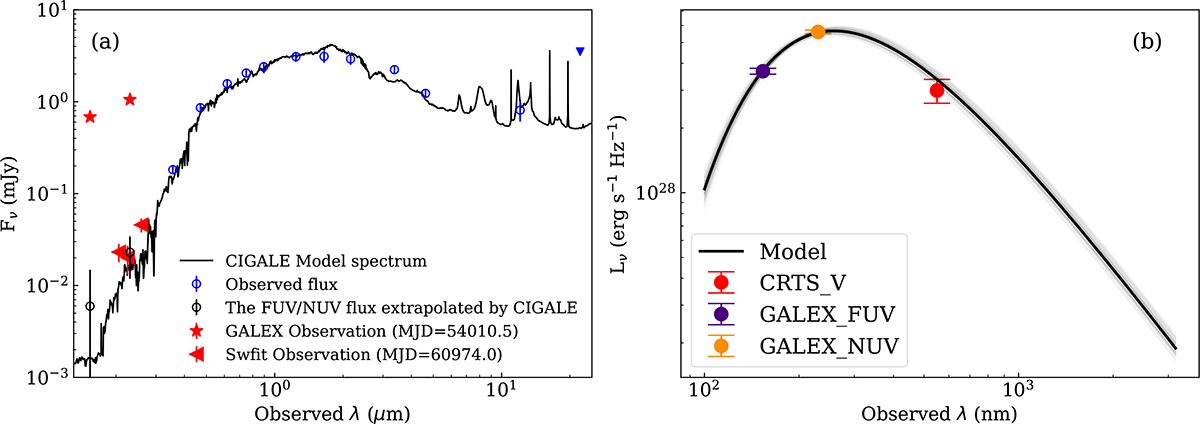
(a): Spectral energy distribution (SED) of AT 2024pvu from UV to MIR. Blue points represent the host galaxy SED in the quiescent state. The black line indicates the best-fitting model from CIGALE with the minimum χ2. We show GALEX and Swift UV photometries as red pentagrams and red triangles, respectively. The SWIFT measurement agrees with the CIGALE prediction (open black circle with error bar), whereas the GALEX measurement shows a significant excess. (b): Spectral energy distribution (SED) of the CRTS flare at the time of the GALEX observation, with blackbody models fitted using MCMC.
Current usage metrics show cumulative count of Article Views (full-text article views including HTML views, PDF and ePub downloads, according to the available data) and Abstracts Views on Vision4Press platform.
Data correspond to usage on the plateform after 2015. The current usage metrics is available 48-96 hours after online publication and is updated daily on week days.
Initial download of the metrics may take a while.