Open Access
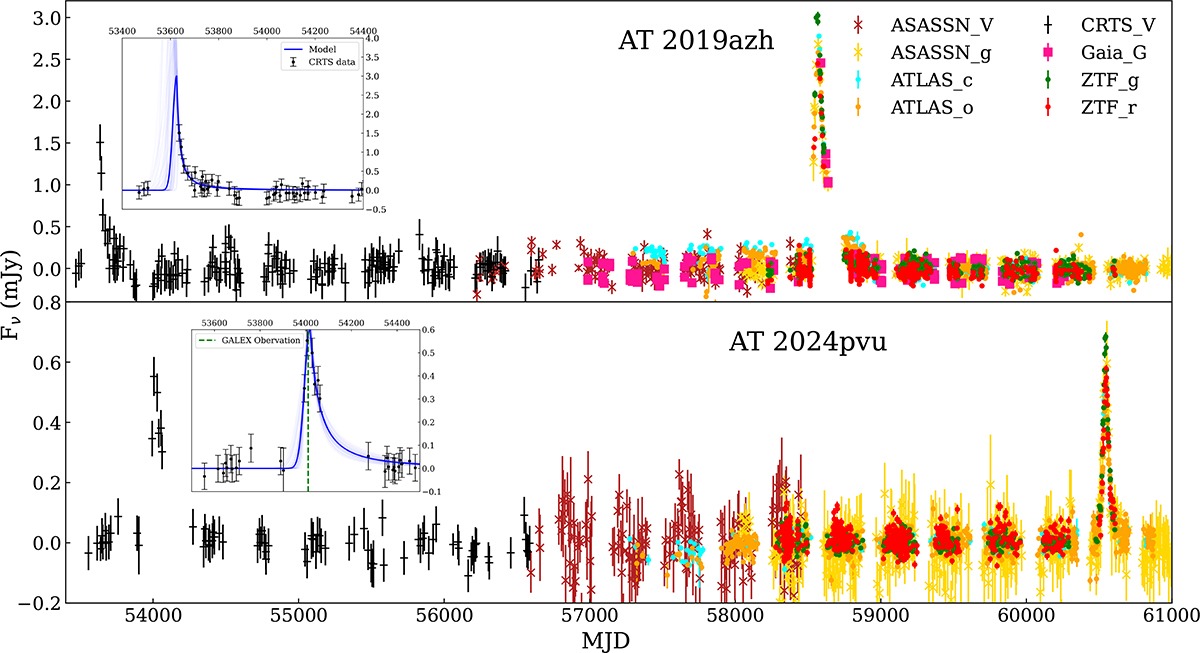
Fig. 1.
Download original image
Host-subtracted optical light curves of AT 2019azh and AT 2024pvu. Insert panels show zoomed views of the CRTS flares and the Gaussian+Power-law (GP) models that fit the data. For AT 2024pvu, the observation time of GALEX is indicated by a dashed green line.
Current usage metrics show cumulative count of Article Views (full-text article views including HTML views, PDF and ePub downloads, according to the available data) and Abstracts Views on Vision4Press platform.
Data correspond to usage on the plateform after 2015. The current usage metrics is available 48-96 hours after online publication and is updated daily on week days.
Initial download of the metrics may take a while.