Fig. 6
Download original image
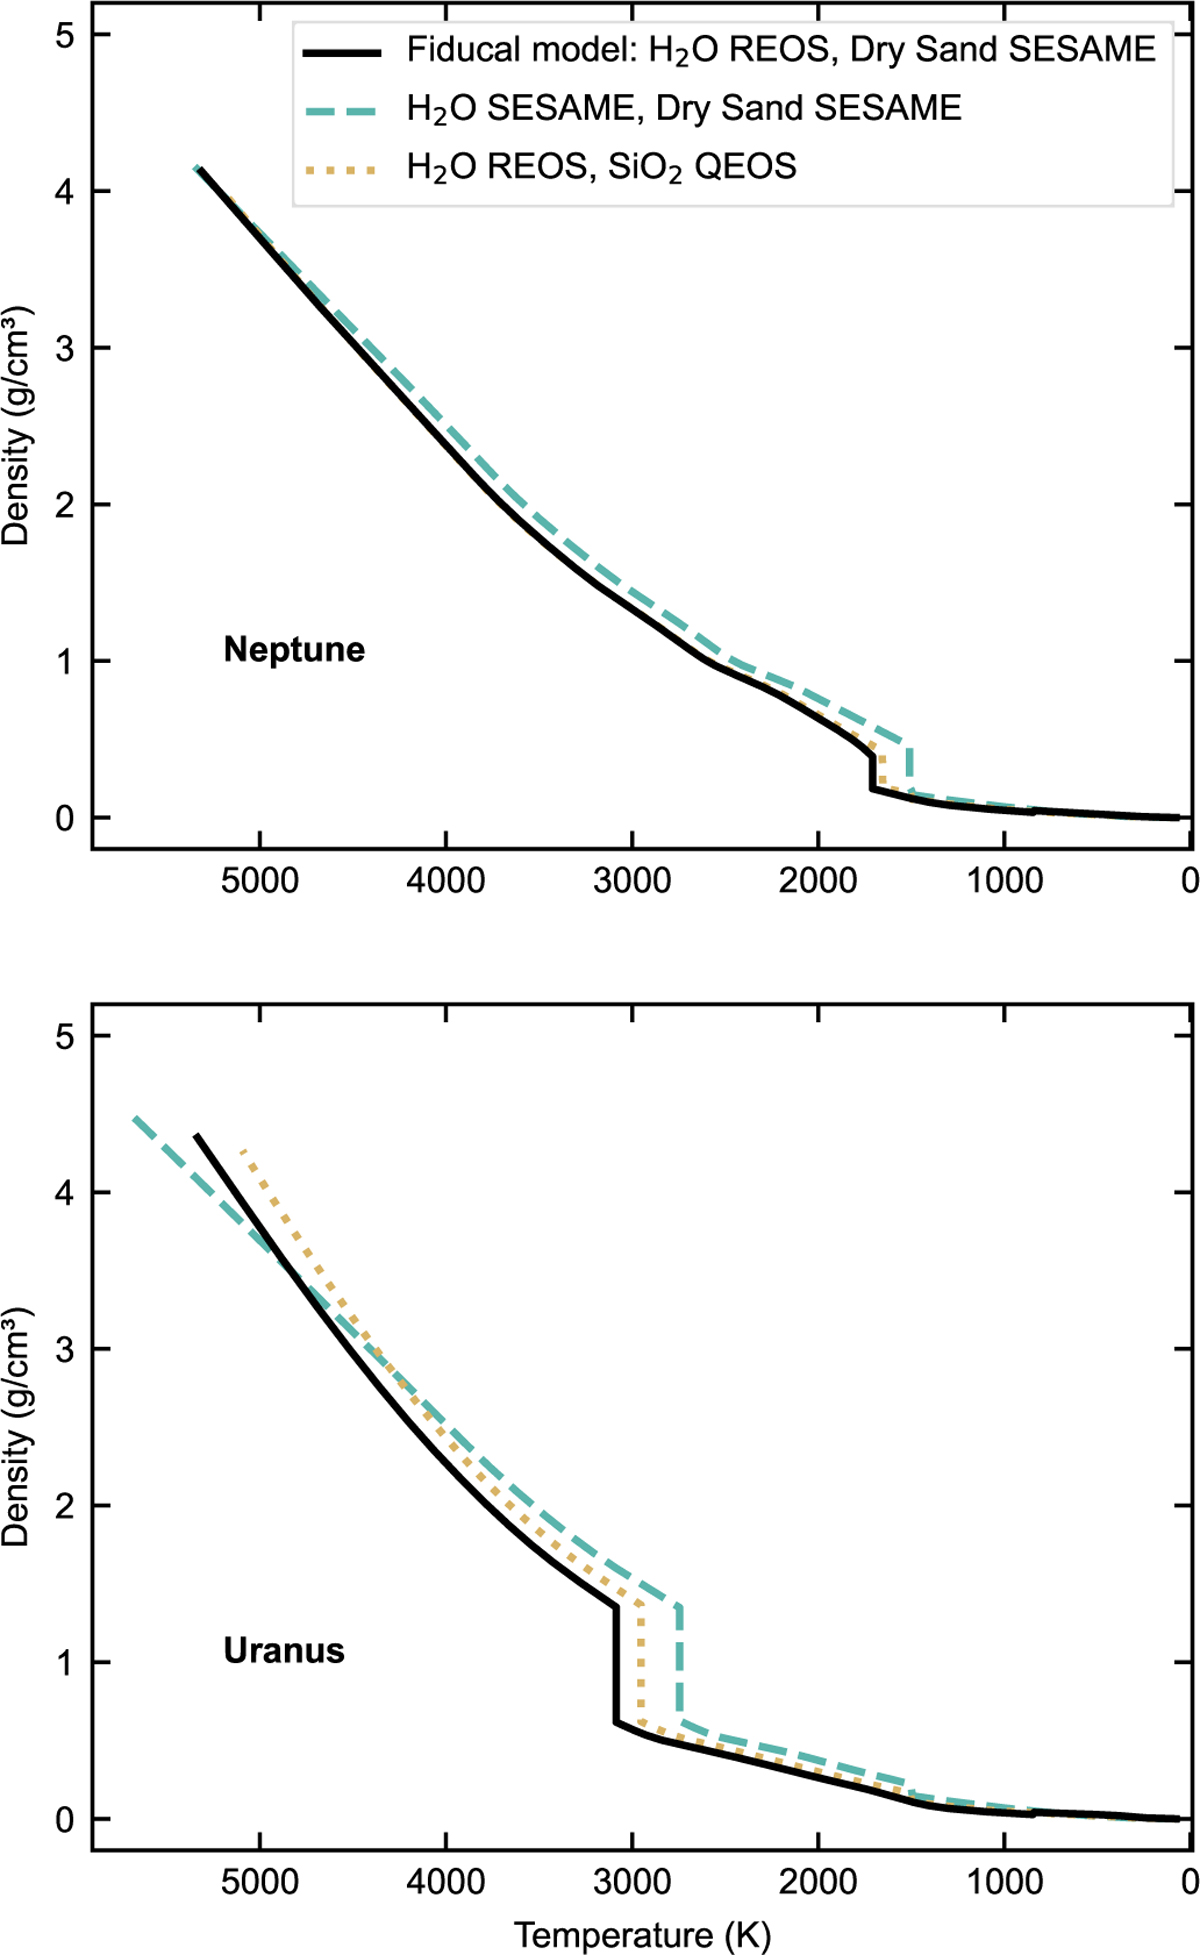
Density as a function of temperature for Neptune (top) and Uranus (bottom). The profiles were calculated using our fiducial model (REOS for water and SESAME Dry Sand for rock; solid black lines) and two alternative test models: one substituting the water EOS with SESAME (dashed blue lines) and another substituting the rock EOS with QEOS for SiO2 (dotted yellow lines). To isolate the effect of the EOS, the profiles for each planet were computed using identical interior parameters drawn from a representative posterior solution. The SESAME water EOS yields denser profiles than the fiducial REOS throughout most of the interior. Similarly, using QEOS for SiO2 instead of SESAME Dry Sand results in denser structural profiles, with the differences being most prominent in Uranus.
Current usage metrics show cumulative count of Article Views (full-text article views including HTML views, PDF and ePub downloads, according to the available data) and Abstracts Views on Vision4Press platform.
Data correspond to usage on the plateform after 2015. The current usage metrics is available 48-96 hours after online publication and is updated daily on week days.
Initial download of the metrics may take a while.