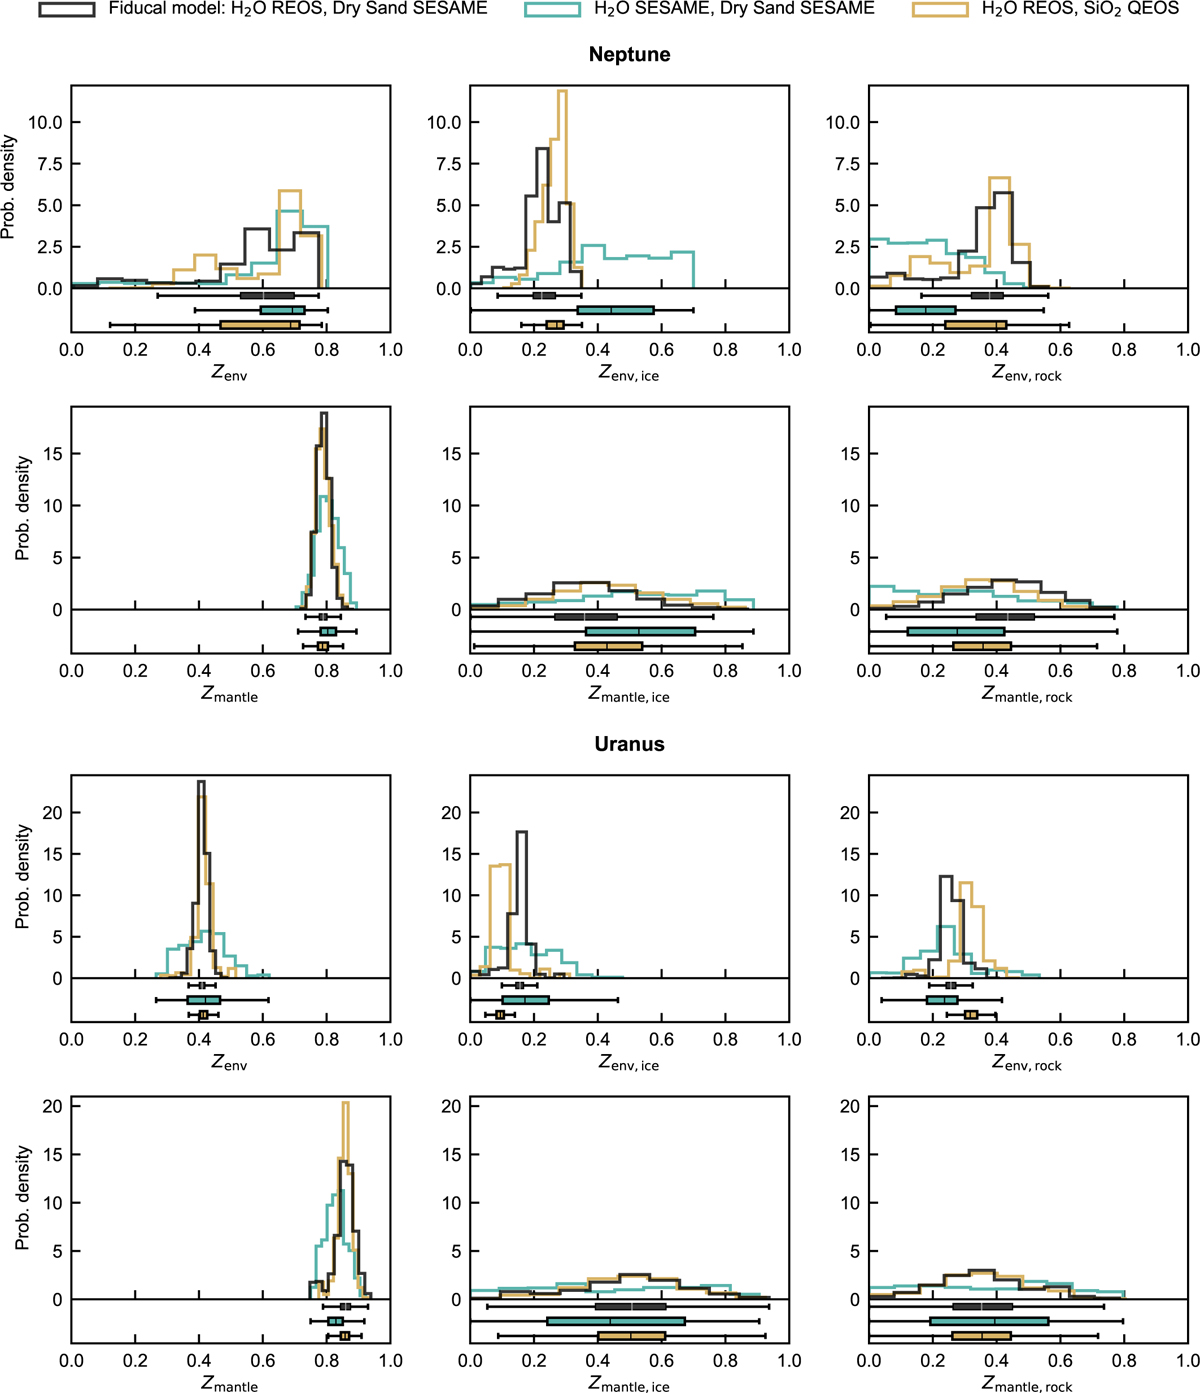
Fig. 5
Download original image
Impact of different EOSs for water and rock on the inferred heavy-element content. We compare the posterior distributions for Neptune (top) and Uranus (bottom), showing the envelope and mantle metallicities, as well as the corresponding ice and rock fractions. The fiducial model (black) adopts REOS for water and the SESAME Dry Sand EOS for the rocky component. This is compared against models that use an alternative water EOS (SESAME; blue) and an alternative rock EOS (QEOS for SiO2; yellow). For both planets, the first row presents results for the envelope (total metallicity and the ice and rock mass mixing ratios), while the second row shows the corresponding quantities for the mantle. The lower panel of each subplot contains box plots summarizing the distributions; the central vertical line indicates the median, the box represents the IQR, and the whiskers extend to values within 1.5 times the IQR.
Current usage metrics show cumulative count of Article Views (full-text article views including HTML views, PDF and ePub downloads, according to the available data) and Abstracts Views on Vision4Press platform.
Data correspond to usage on the plateform after 2015. The current usage metrics is available 48-96 hours after online publication and is updated daily on week days.
Initial download of the metrics may take a while.