Fig. 4
Download original image
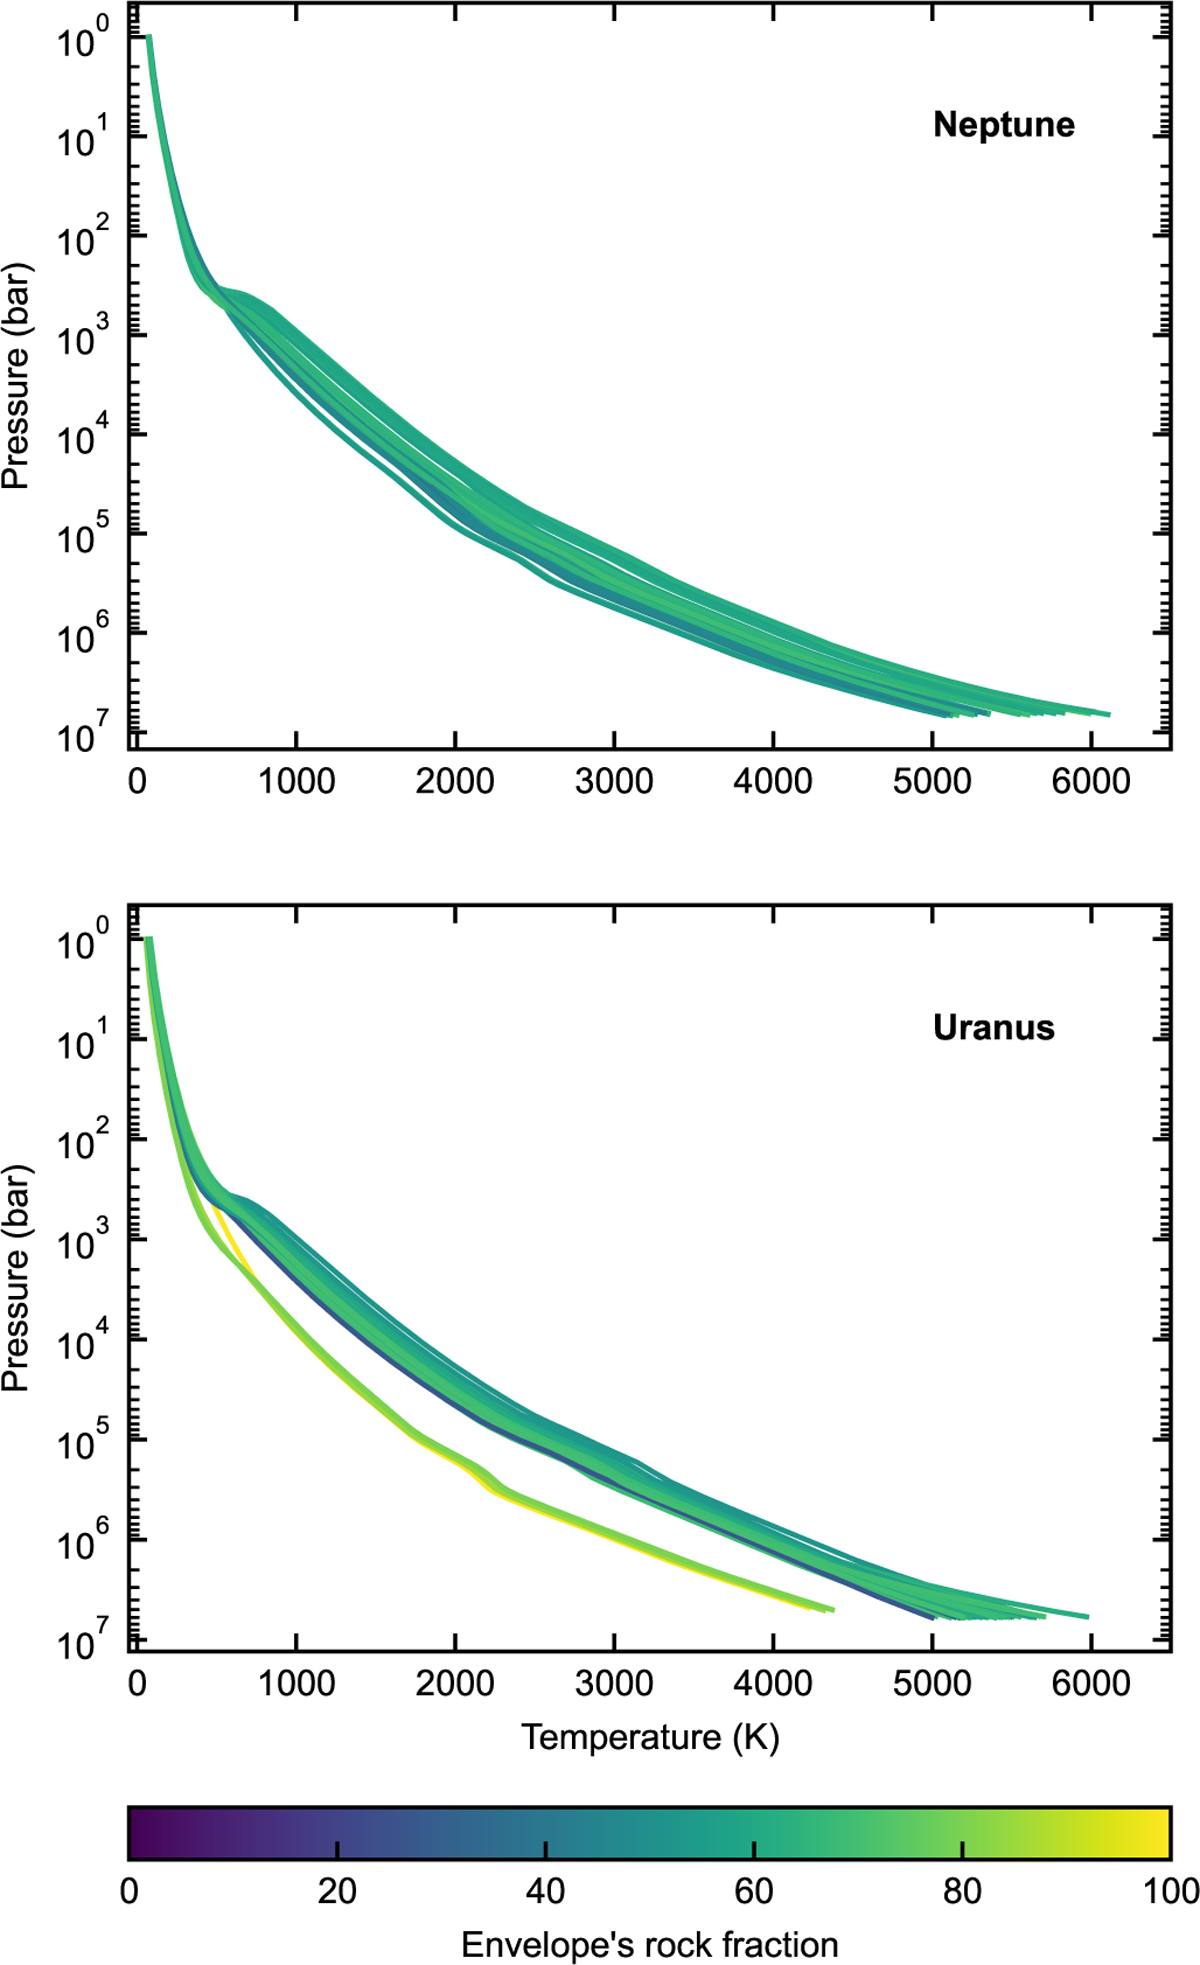
Impact of rock fraction on the planetary P–T profiles. Shown are the P–T profiles of Neptune (top) and Uranus (bottom) for a representative sample of 100 interior models that satisfy the observational constraints. The curves are color-coded by the effective global rock fraction in the envelope (relative to its total heavy element content), such that each model is represented by a single color. Note that while a single global value is shown per model, the local rock abundance is physically restricted to regions where the temperature exceeds the silicate condensation threshold and is zero at lower temperatures (as described in Sect. 2). Models with lower envelope rock fractions, corresponding to higher ice (water) content, exhibit higher interior temperatures.
Current usage metrics show cumulative count of Article Views (full-text article views including HTML views, PDF and ePub downloads, according to the available data) and Abstracts Views on Vision4Press platform.
Data correspond to usage on the plateform after 2015. The current usage metrics is available 48-96 hours after online publication and is updated daily on week days.
Initial download of the metrics may take a while.