Fig. 3
Download original image
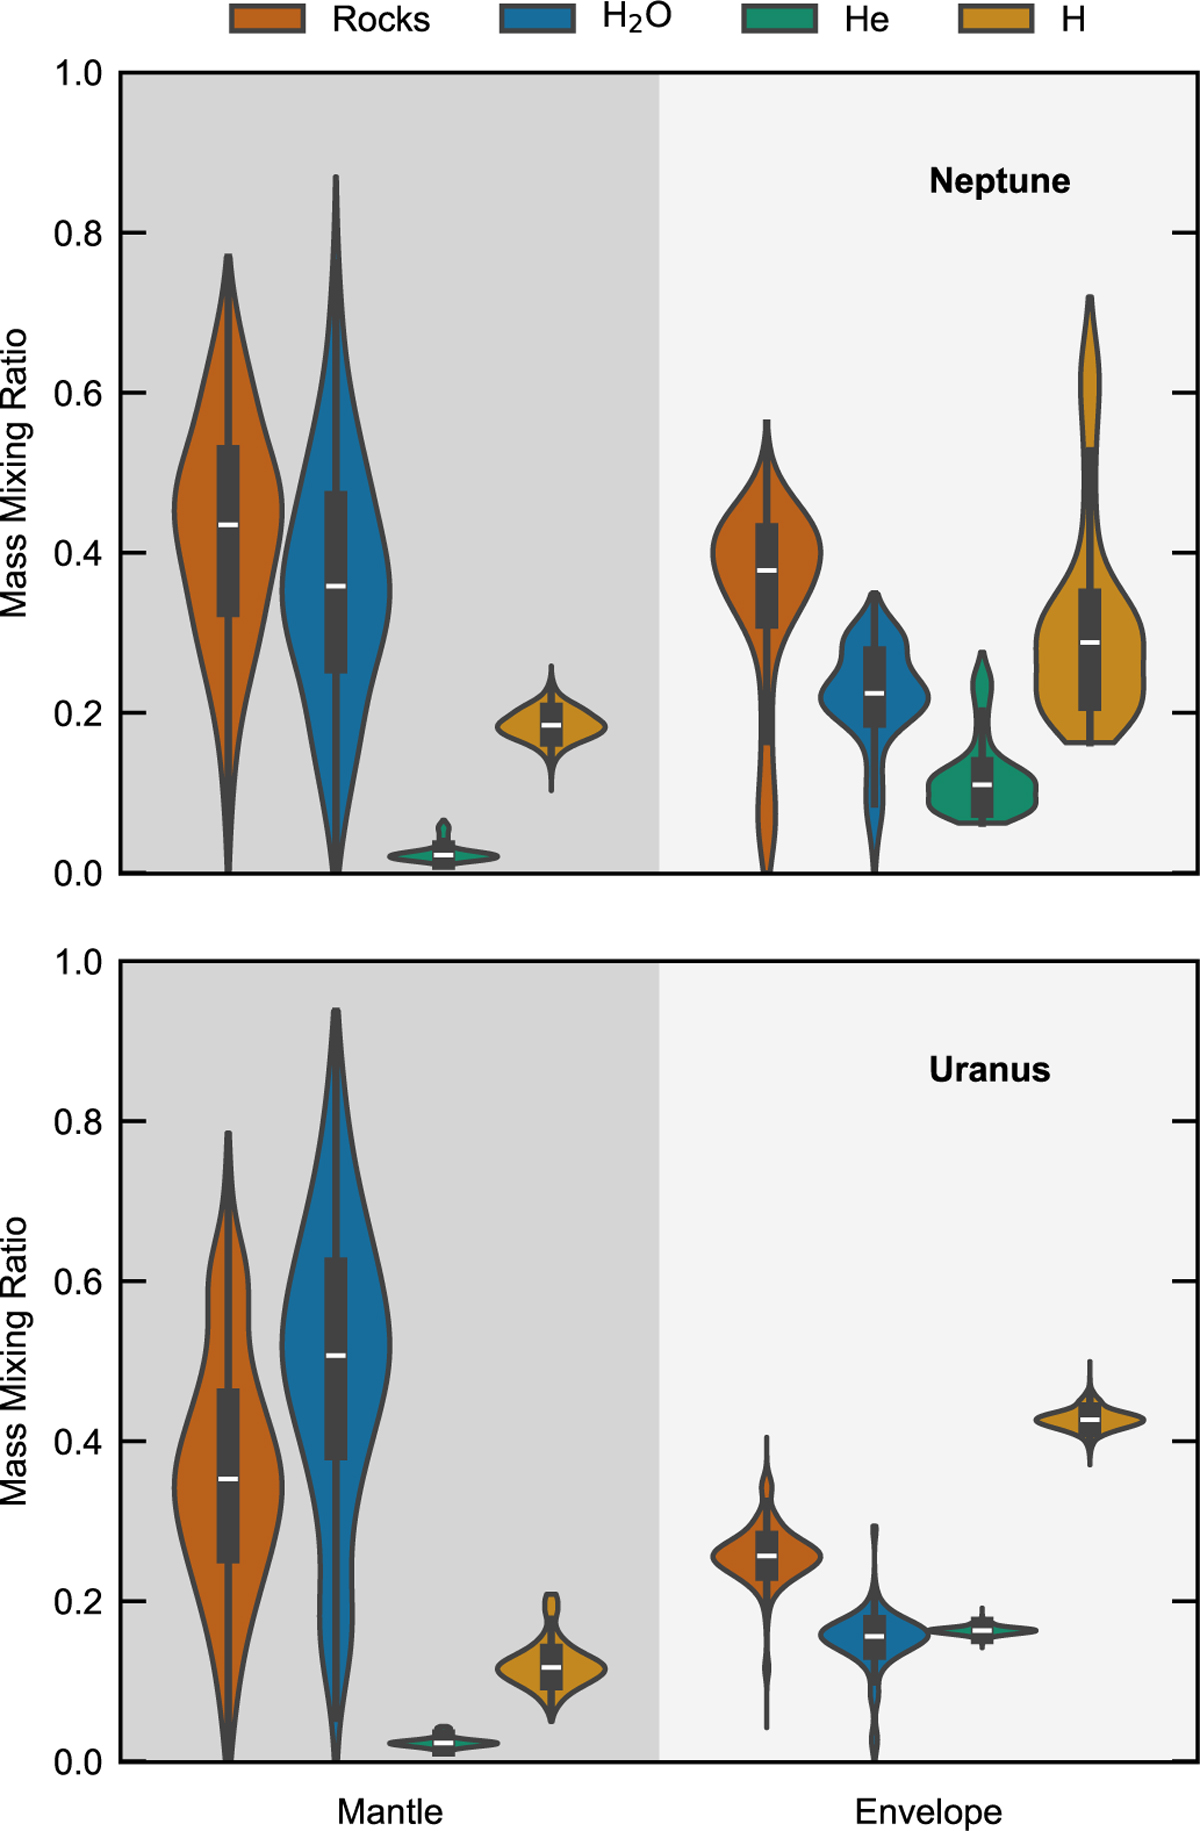
Elemental abundances in the interiors of Uranus and Neptune. Violin plots depict the distribution of hydrogen, helium, water, and rock abundances across our interior solutions for the ice giants. Top: Neptune. Bottom: Uranus. The gray-shaded region on the left represents the mantle, while the lighter region on the right represents the envelope. Each violin plot combines the probability density (indicated by the width of the plot) with central abundance tendencies. The white horizontal line indicates the median, the thick black bar shows the IQR, and the thin black whiskers extend to the range of values within 1.5 times the IQR.
Current usage metrics show cumulative count of Article Views (full-text article views including HTML views, PDF and ePub downloads, according to the available data) and Abstracts Views on Vision4Press platform.
Data correspond to usage on the plateform after 2015. The current usage metrics is available 48-96 hours after online publication and is updated daily on week days.
Initial download of the metrics may take a while.