Fig. 2
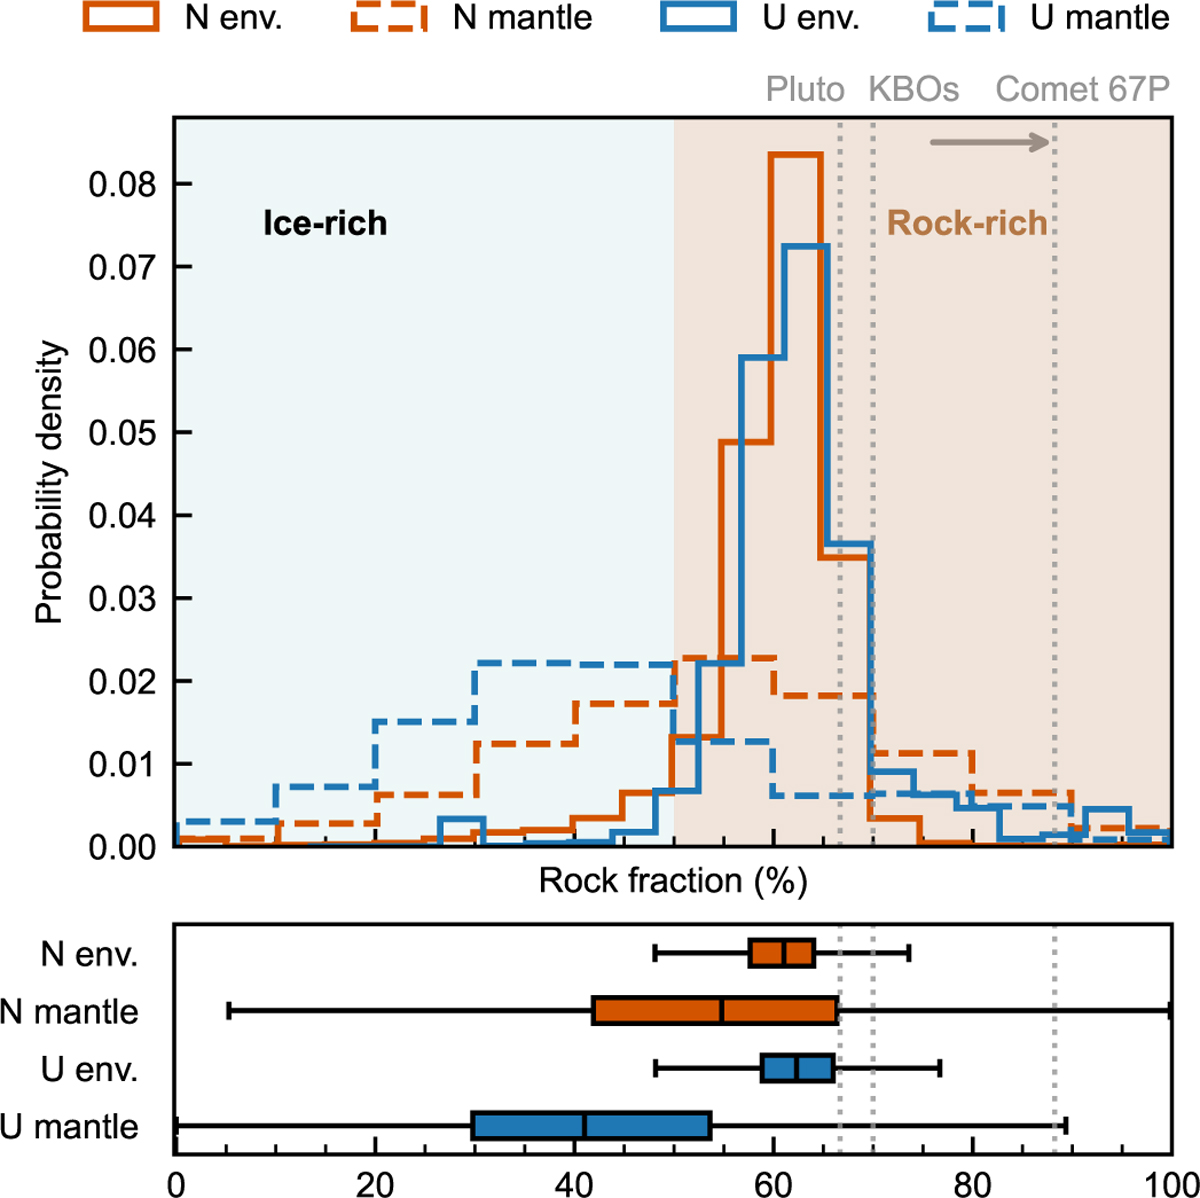
Download original image
Rock fractions in the ice giants. The distributions of rock fractions derived from our interior models are plotted for Neptune (red lines) and Uranus (blue lines). Top: Probability density of rock fractions for the envelope (solid lines) and mantle (dashed lines) of each planet. For comparison, rock fractions for Pluto (McKinnon et al. 2017), Kuiper belt objects (KBOs; based on a sample of 15 objects; Bierson & Nimmo 2019), and the range of values reported for comet 67P/Churyumov–Gerasimenko (Rotundi et al. 2015; Fulle et al. 2016, 2017, 2019) are also plotted, as vertical dotted gray lines. Note that the rock fraction is defined as the mass mixing ratio of rocks normalized by the total metallicity (rocks + ices) and therefore does not represent the total mass fraction of the layer. Bottom: Box plots that summarize the distribution of rock fractions in the envelope and mantle for both planets. Each box plot illustrates the interquartile range (IQR; spanning the 25th to 75th percentiles, represented by the width of the box), the median (black center line), and the data spread (whiskers extending to values within 1.5 times the IQR). Our results suggest that the envelopes of Uranus and Neptune are rock-dominated, with rock fractions consistent with those of outer Solar System objects.
Current usage metrics show cumulative count of Article Views (full-text article views including HTML views, PDF and ePub downloads, according to the available data) and Abstracts Views on Vision4Press platform.
Data correspond to usage on the plateform after 2015. The current usage metrics is available 48-96 hours after online publication and is updated daily on week days.
Initial download of the metrics may take a while.