Fig. 2.
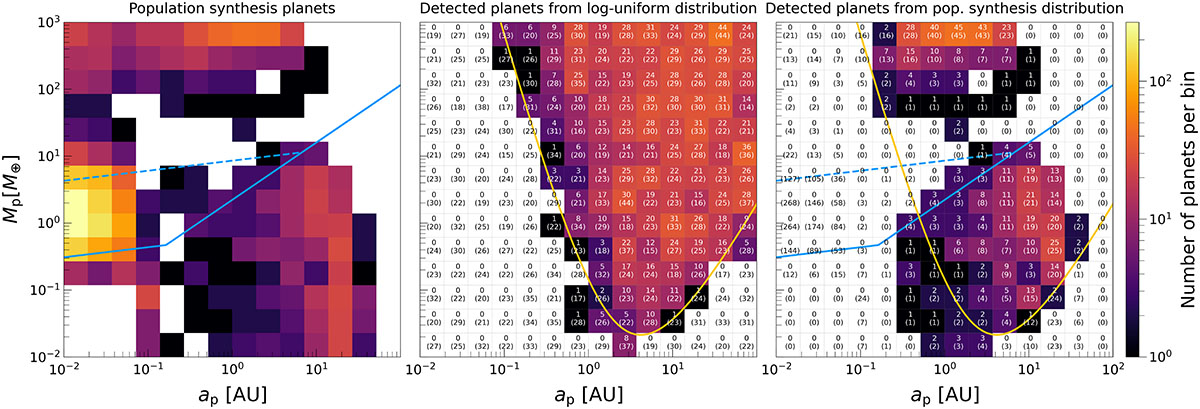
Download original image
Left panel: Synthetic exoplanet population, colour-coded by the number of planets per bin within the logarithmic semi-major axis and planet mass space, according to the nominal model for a sample of Nstar = 5000 stars with different masses (Sect. 3.2). For reference, we show the pebble isolation mass as a function of orbital radius, for a 0.2 M⊙ star, at the initial (dashed blue) and final simulation time (solid blue). Central panel: Total number of detected lensing planets per bin, assuming an underlying log-uniform distribution of 5000 planets in terms of semi-major axis and mass, with the lensing detection efficiency specified in Sect. 3.2. Annotated in each bin is the number of planets detected per bin, with the underlying number of planets in that bin in parentheses. The solid orange line shows the three-planet detection line for the Roman Space Telescope (Penny et al. 2019). Right panel: Total number of detected lensing planets per bin, using the synthetic population shown in the left panel. There is a dearth of planets with masses near the pebble isolation mass at the approximate location of the water ice line in the high-sensitivity region of lensing surveys.
Current usage metrics show cumulative count of Article Views (full-text article views including HTML views, PDF and ePub downloads, according to the available data) and Abstracts Views on Vision4Press platform.
Data correspond to usage on the plateform after 2015. The current usage metrics is available 48-96 hours after online publication and is updated daily on week days.
Initial download of the metrics may take a while.