Fig. 9.
Download original image
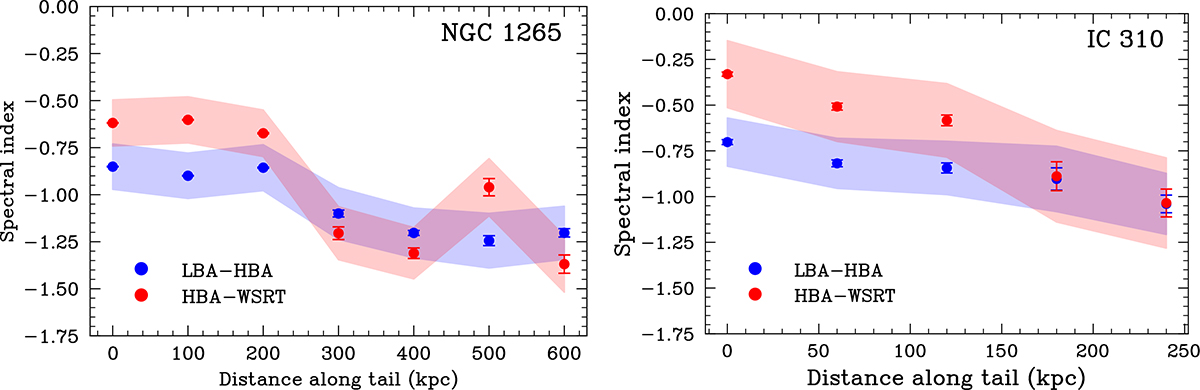
Spectral indices along the tails of NGC 1265 and IC 310. The flux densities are measured in circular regions with radii of 1.8′and 1′at equal spacings of 100 kpc and 60 kpc for NGC 1265 and IC 310, respectively. These regions are marked with circles in the cutout images presented in Figs. D.1 and D.2. The error bars indicate the spectral index uncertainty when taking only the r.m.s. map noise into account (relevant for comparing the evolution of the spectral index along a spatial dimension), while the shaded regions include the 10% flux density uncertainty (relevant for comparing the spectral index between different frequencies).
Current usage metrics show cumulative count of Article Views (full-text article views including HTML views, PDF and ePub downloads, according to the available data) and Abstracts Views on Vision4Press platform.
Data correspond to usage on the plateform after 2015. The current usage metrics is available 48-96 hours after online publication and is updated daily on week days.
Initial download of the metrics may take a while.