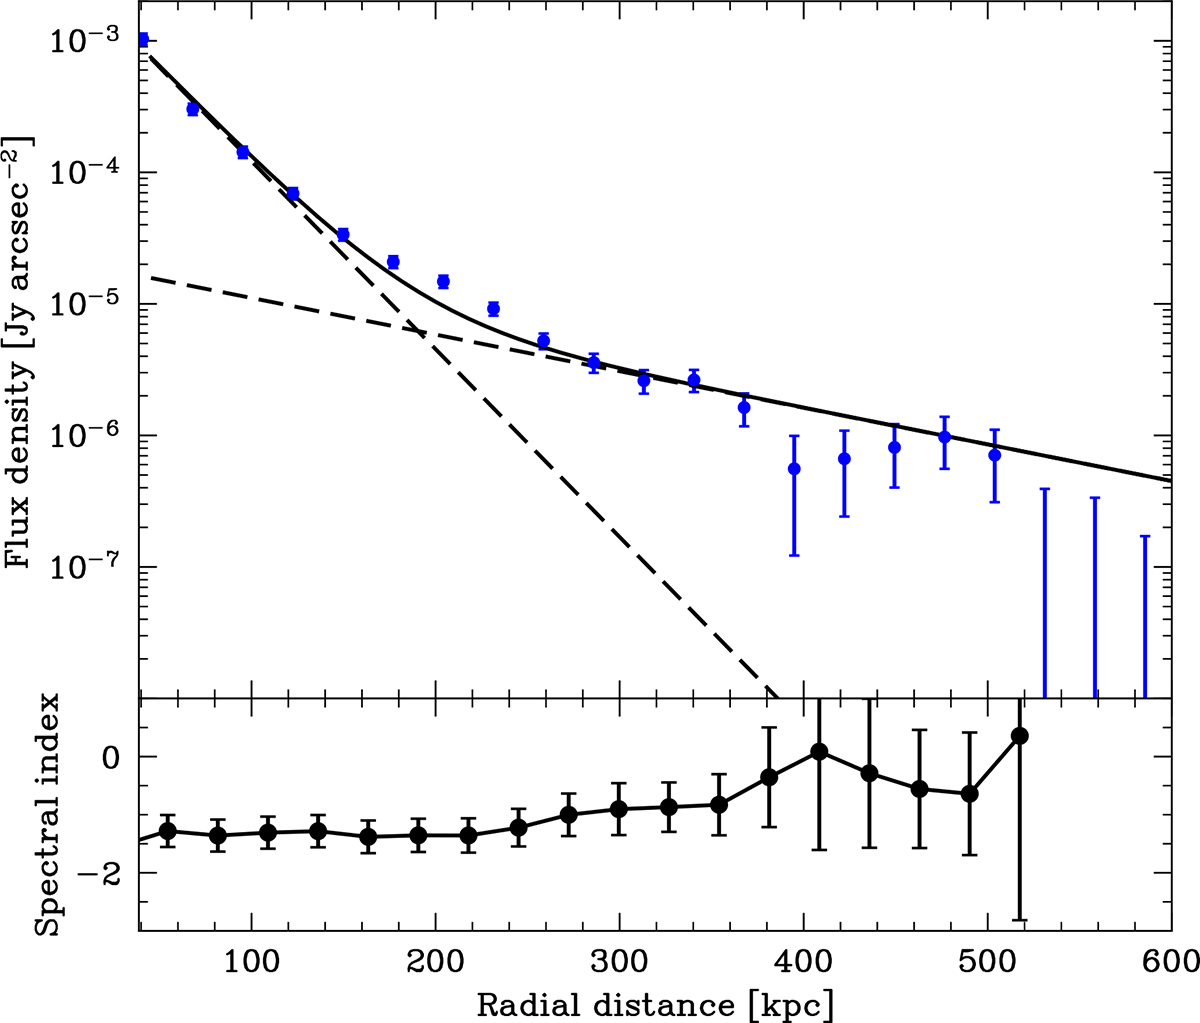
Fig. 3.
Download original image
Radial surface brightness profile of the diffuse radio emission in the Perseus cluster. The dashed lines represent two exponential profiles that add up to the continuous line (Eq. 1). The model was fitted using the extracted radial profile of the Perseus image, with point sources subtracted and residual sources masked out, starting from 43 kpc from the centre to 650 kpc. We note that the error bars do not include the 10% uncertainty on the adopted flux density scale, as this uncertainty is identical between all data points. In the bottom panel, the spectral index between LOFAR LBA (43 MHz) and LOFAR HBA (144 MHz) is shown with error bars (which do not include the 10% uncertainty). We note that at larger radial distances from 3C 84, the error on the spectral index drastically increases.
Current usage metrics show cumulative count of Article Views (full-text article views including HTML views, PDF and ePub downloads, according to the available data) and Abstracts Views on Vision4Press platform.
Data correspond to usage on the plateform after 2015. The current usage metrics is available 48-96 hours after online publication and is updated daily on week days.
Initial download of the metrics may take a while.