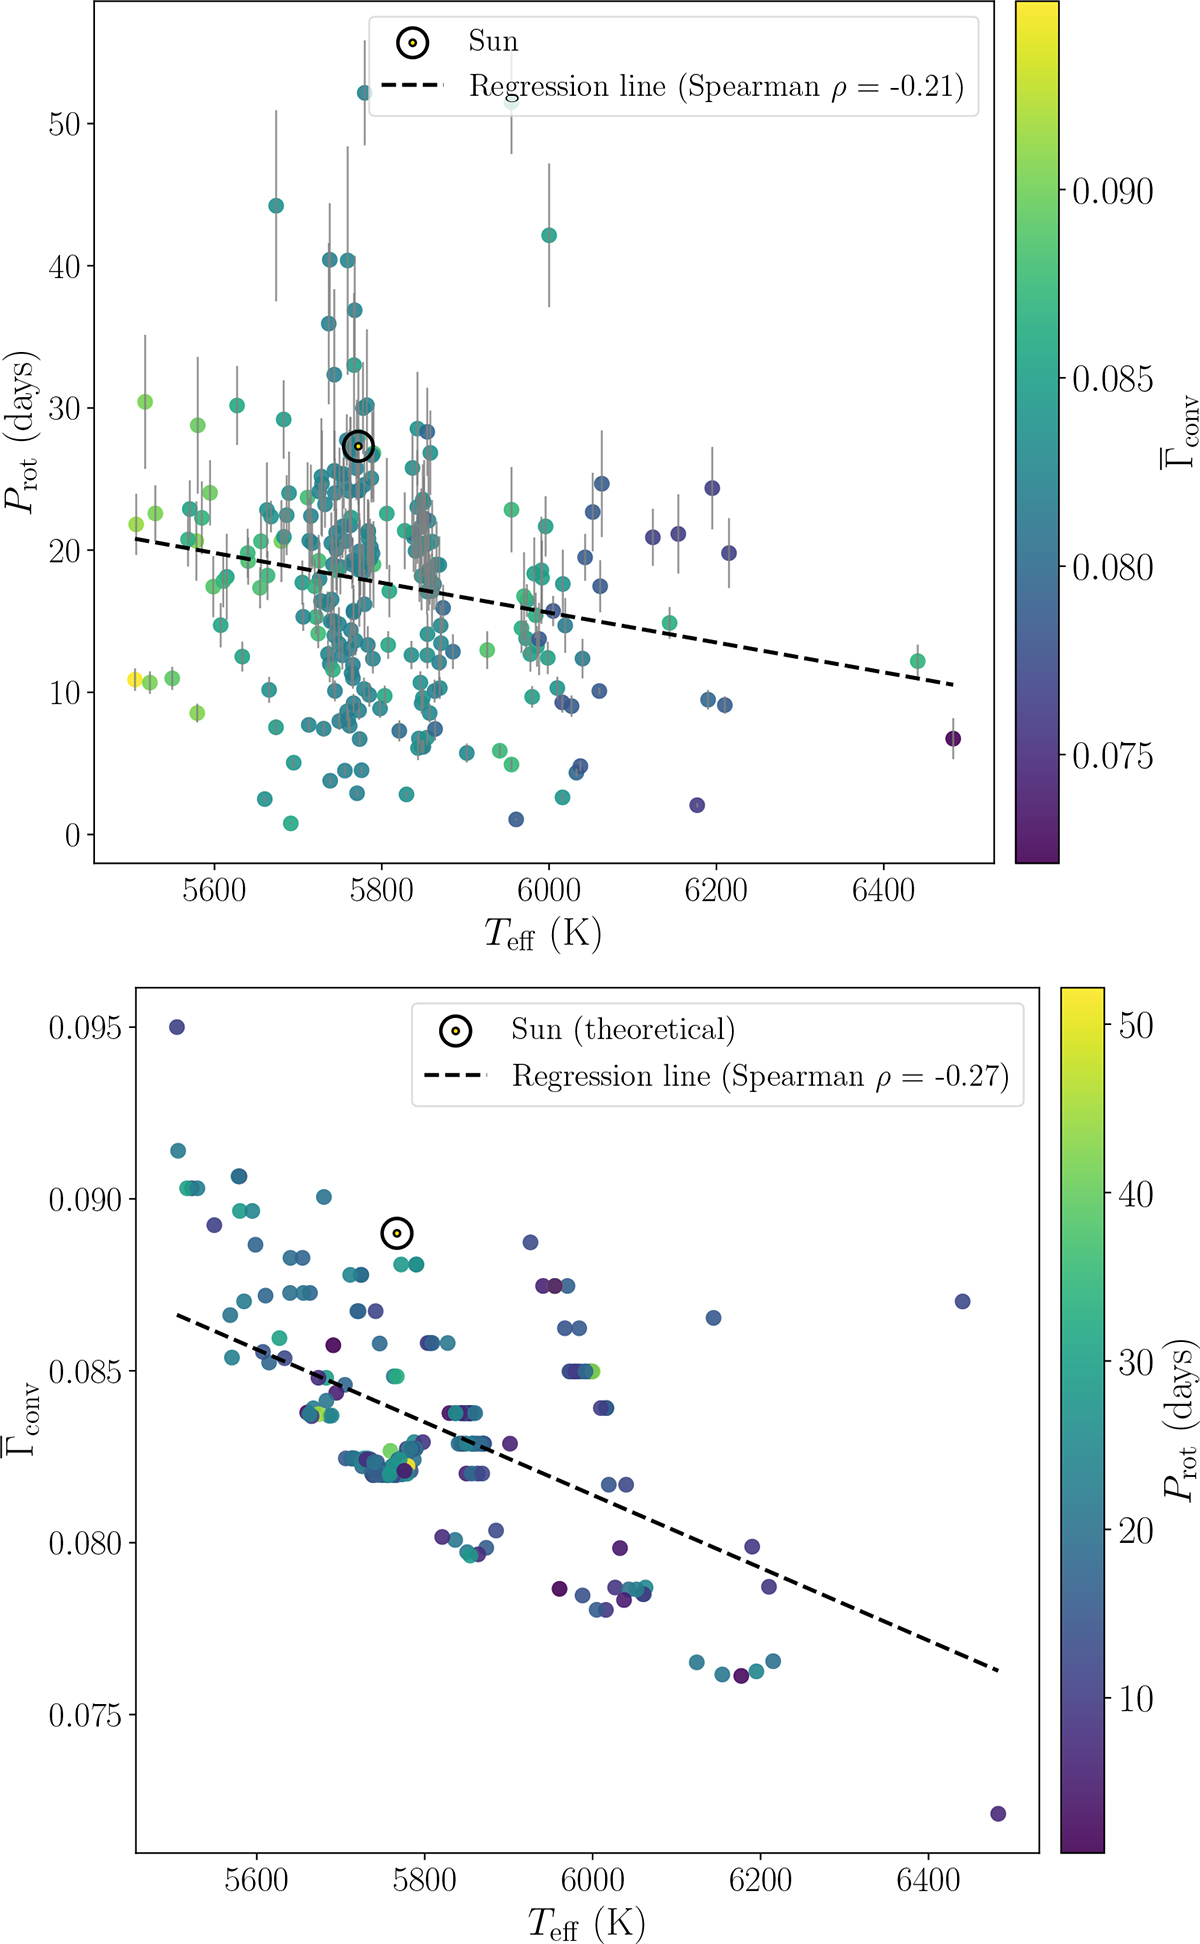
Fig. 6.
Download original image
Top panel: Rotation periods as a function of effective temperature for the sample of 243 1 M⊙ stars described in Section 2. Data points are color-coded by the values of the convective plasma parameter, and the gray bars indicate the observational uncertainties in the rotation periods. A linear regression fit to the data yields a Spearman correlation coefficient of ρ = −0.21 with a p-value of 1.4 × 10⁻⁵. Bottom panel: Convective plasma parameter (Eq. 4) as a function of effective temperature for the same set of stars. Data points are color-coded by the measured rotation periods. A linear regression fit yields a Spearman correlation coefficient of ρ = −0.27 with a p-value of 1.2 × 10⁻³. For reference, the solar values are indicated by the symbol ⊙. The theoretical solar model is computed using the GS98 metallicity.
Current usage metrics show cumulative count of Article Views (full-text article views including HTML views, PDF and ePub downloads, according to the available data) and Abstracts Views on Vision4Press platform.
Data correspond to usage on the plateform after 2015. The current usage metrics is available 48-96 hours after online publication and is updated daily on week days.
Initial download of the metrics may take a while.