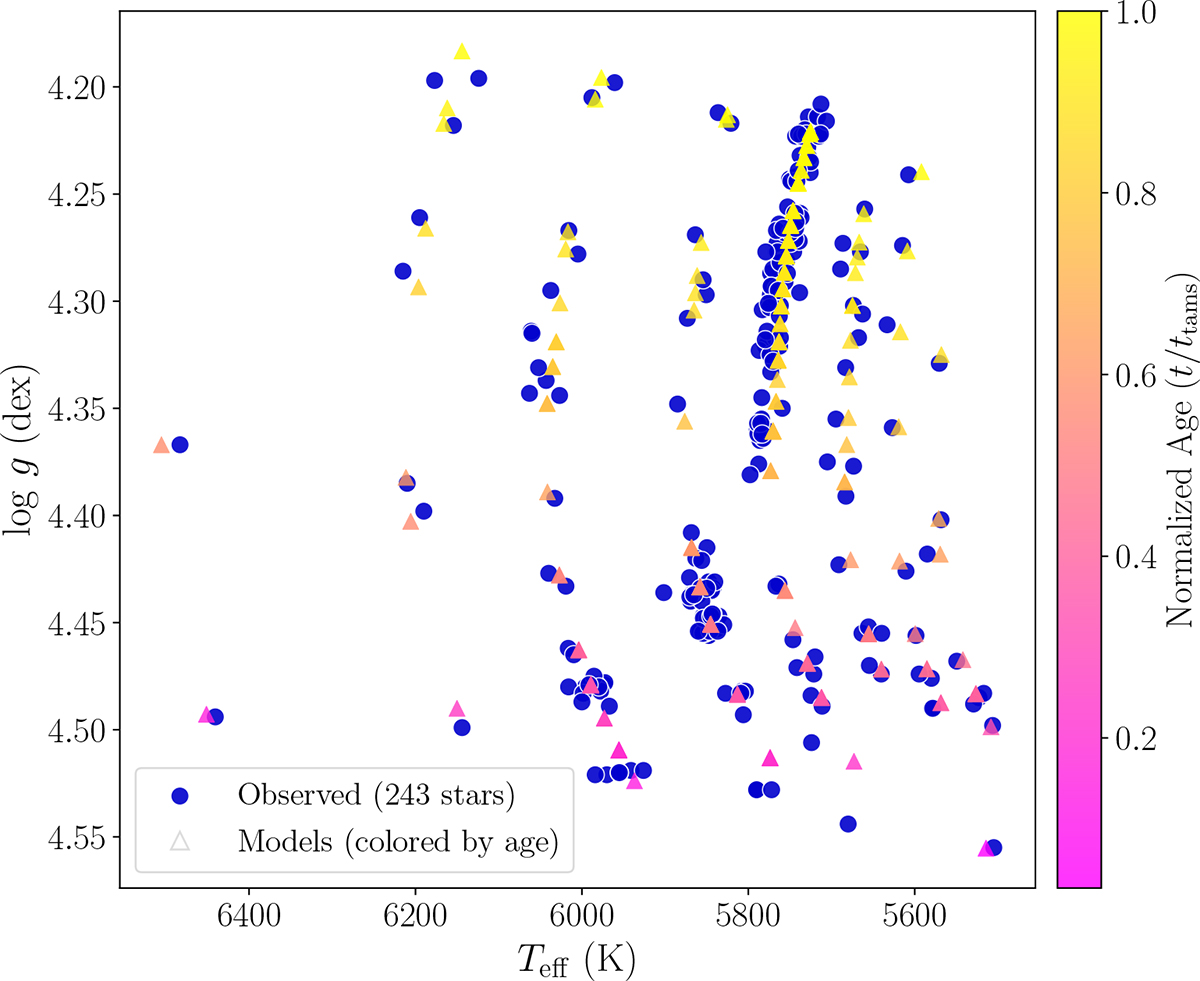
Fig. 3.
Download original image
Kiel diagram comparing observed stellar parameters with best-fit theoretical models. The blue circles represent the 243 observed main-sequence stars (0.99 M⊙ < M < 1.005 M⊙), while the age-colored triangles show their corresponding best-fit 1 M⊙ theoretical models from our chi-square matching procedure. The color scale indicates the normalized stellar age. The clear progression from younger (pink) to older (yellow) models along the evolutionary track demonstrates that our matching algorithm successfully recovers physically meaningful age sequences.
Current usage metrics show cumulative count of Article Views (full-text article views including HTML views, PDF and ePub downloads, according to the available data) and Abstracts Views on Vision4Press platform.
Data correspond to usage on the plateform after 2015. The current usage metrics is available 48-96 hours after online publication and is updated daily on week days.
Initial download of the metrics may take a while.