Fig. 2.
Download original image
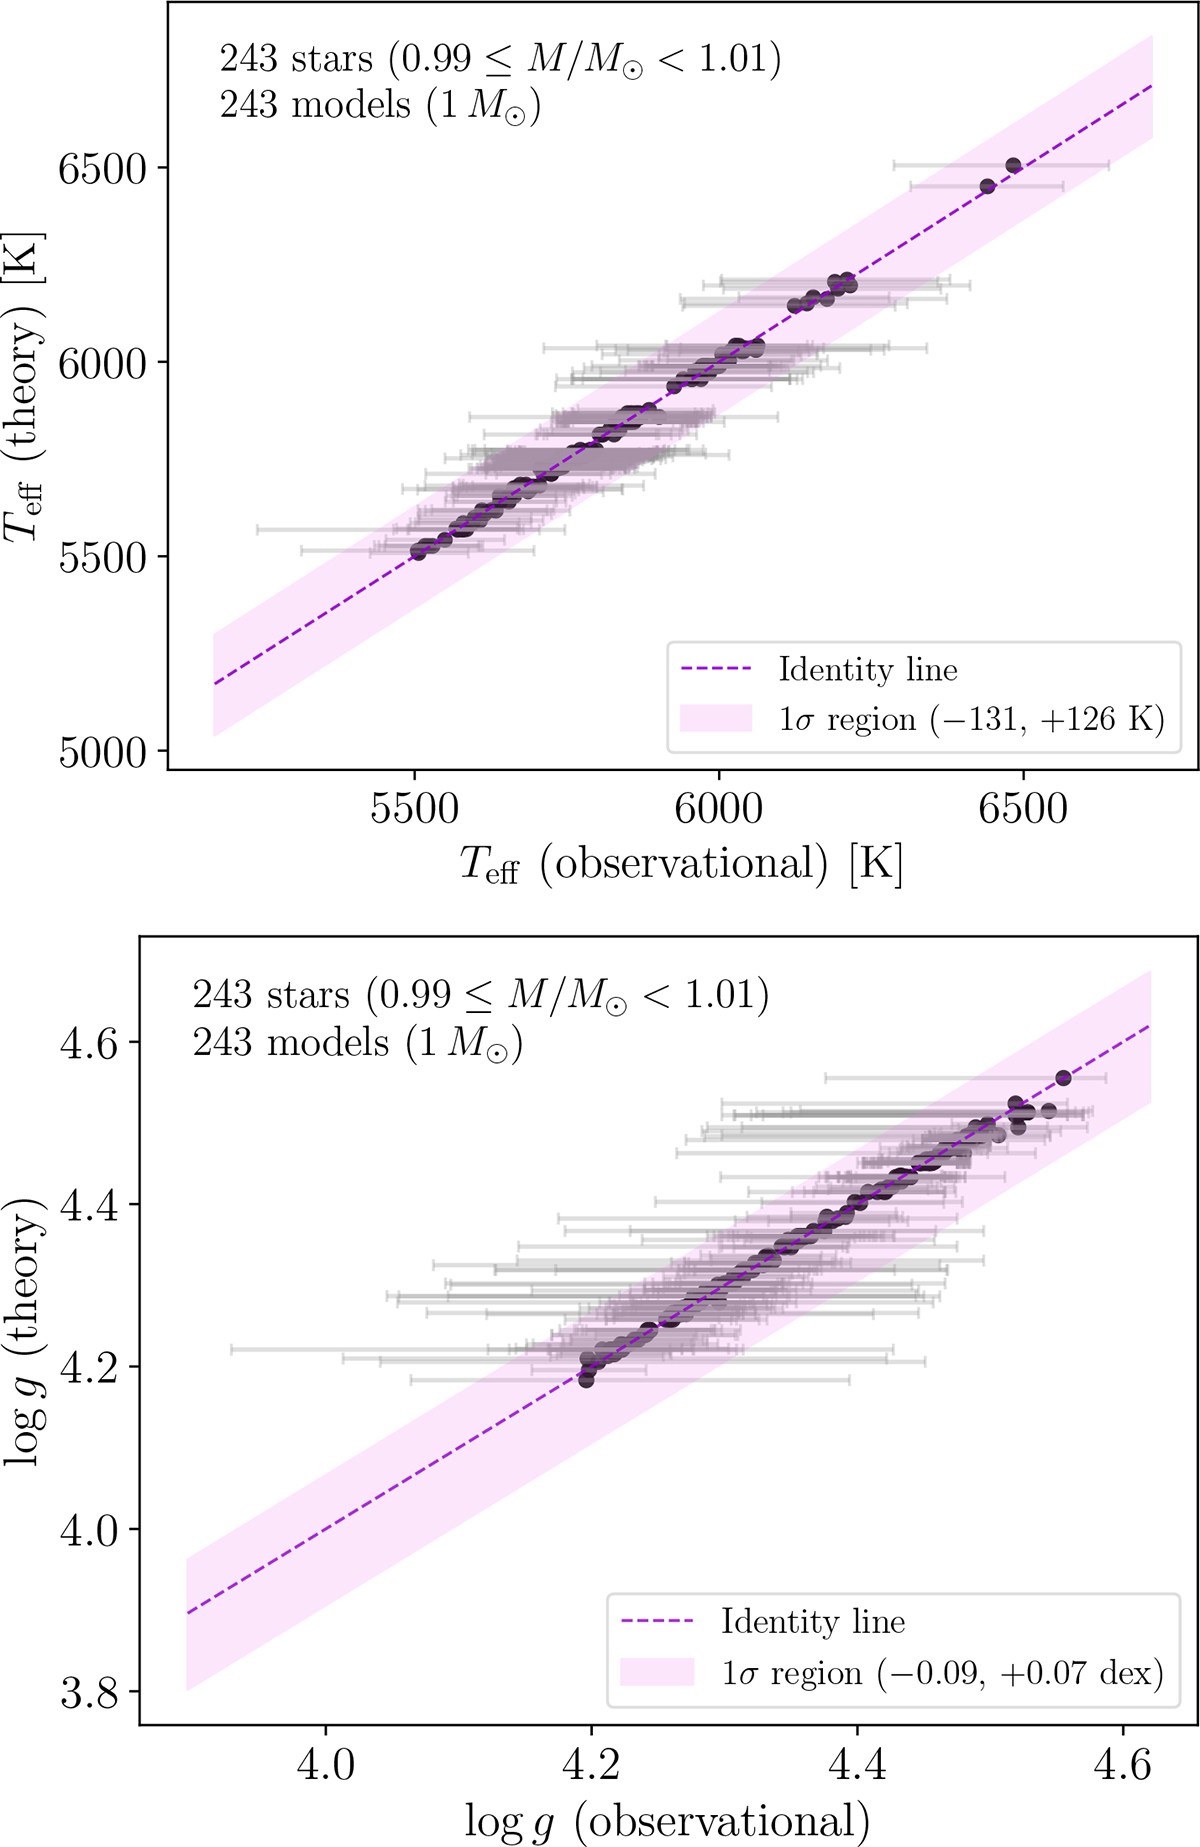
Comparison between observed and best-fit theoretical stellar parameters for our sample of 243 main-sequence stars with masses 0.99 M⊙ < M < 1.005 M⊙, matched to 1 M⊙ theoretical models. Top panel: Effective temperature (Teff) identity plot. Bottom panel: Surface gravity (log g) identity plot. In both panels, the dashed violet line represents the one-to-one relation, while the shaded violet band indicates the typical 1σ asymmetric observational uncertainty region. Individual asymmetric error bars for each star are shown in gray. The close clustering of points around the identity lines demonstrates the robustness of our chi-square matching algorithm in recovering physically consistent atmospheric parameters.
Current usage metrics show cumulative count of Article Views (full-text article views including HTML views, PDF and ePub downloads, according to the available data) and Abstracts Views on Vision4Press platform.
Data correspond to usage on the plateform after 2015. The current usage metrics is available 48-96 hours after online publication and is updated daily on week days.
Initial download of the metrics may take a while.