


Fig. B.1.
Download original image
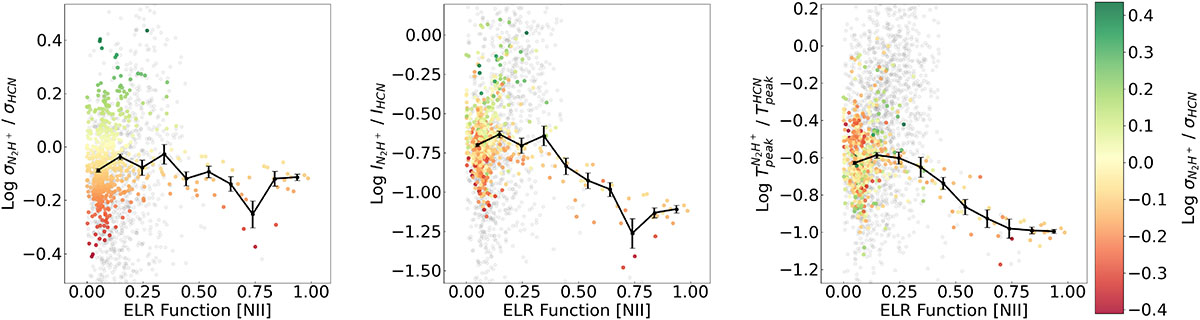
Comparisons of how line width, line intensity, and peak temperature ratios vary with the ELR function. For every column, points are color-coded by the ratio of line widths for N2H+ and HCN, with green indicating N2H+ is the broader line and red indicating HCN is the broader line. Gray points indicate pixels where the S/N of one or both lines is less than three. The black points show the median y axis value in bins of ELR, with the error on the mean shown as a vertical bar. Left: Ratio of line widths for N2H+ and HCN with respect to the ELR function. In general, this ratio has a flat trend with ELR, indicating that the central AGN regions do not pick out distinct regions where the broadening of these two lines differ. However, in the center of the galaxy where ELR is high, HCN is always slightly broader than N2H+. Middle: Similar plot but with the ratio of integrated intensities on the y axis (the main method for determining line ratios in this work). As ELR increases the ratio of integrated intensities drops as HCN outshines N2H+. Importantly this trend is not entirely the result of HCN broadening compared to N2H+, as many red points (indicating a low ratio of line widths) are within the star-forming regime where ELR < 0.5. Right: Ratio of peak temperatures of these lines with respect to the ELR function. Peak temperature should be less impacted by line broadening, yet a clear trend of a decreasing ratio with increasing ELR persists.
Current usage metrics show cumulative count of Article Views (full-text article views including HTML views, PDF and ePub downloads, according to the available data) and Abstracts Views on Vision4Press platform.
Data correspond to usage on the plateform after 2015. The current usage metrics is available 48-96 hours after online publication and is updated daily on week days.
Initial download of the metrics may take a while.