


Fig. A.1.
Download original image
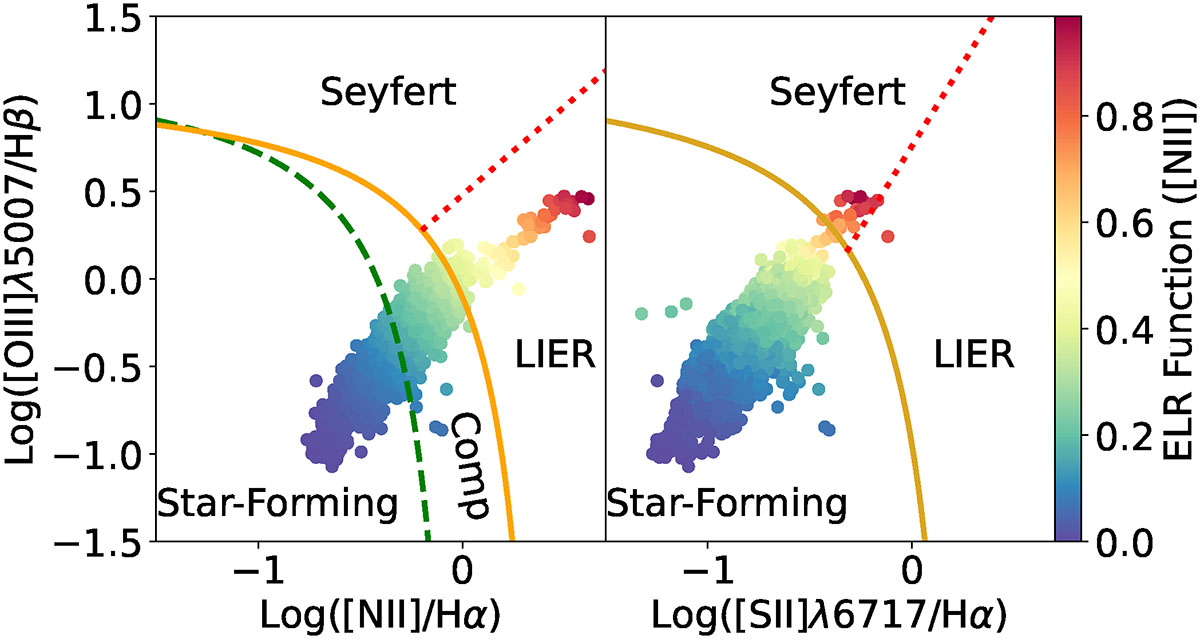
Two alternative BPT diagrams to distinguish star formation from Seyfert and LIER emission, demonstrating how different BPT diagnostics may impact results presented here. All points are color-coded by the ELR function based on the [NII] BPT established in this work. Left: BPT diagram using [NII]λ6584/Hα, similar to the one used in the main analysis but with additional separation of Seyfert and LIER emission. The Kauffmann et al. (2003) dashed green line selects for HII-region ionization, and the Kewley et al. (2001) gold line selects AGN ionization. The pixels in between these two lines are considered “composite”. An additional distinction from Cid Fernandes et al. (2010, dashed red line) separates Seyfert ionization (top) from LIER emission (bottom). In the case of this BPT diagram, all “AGN” regions defined by the ELR would actually fall in the LIER regime, and thus are more likely to stem from shocks. Right: BPT diagram using [SII]λ6717/Hα instead of [NII]λ6584/Hα. Points below the Kewley et al. (2006a) gold line stem from HII-region ionization, and Seyfert and LIER emission above this told line are again distinguished by the Cid Fernandes et al. (2010) dashed red line. In the case of this BPT, in contrast to the left, all ELR > 0.5 values but one fall into the Seyfert regime.
Current usage metrics show cumulative count of Article Views (full-text article views including HTML views, PDF and ePub downloads, according to the available data) and Abstracts Views on Vision4Press platform.
Data correspond to usage on the plateform after 2015. The current usage metrics is available 48-96 hours after online publication and is updated daily on week days.
Initial download of the metrics may take a while.