


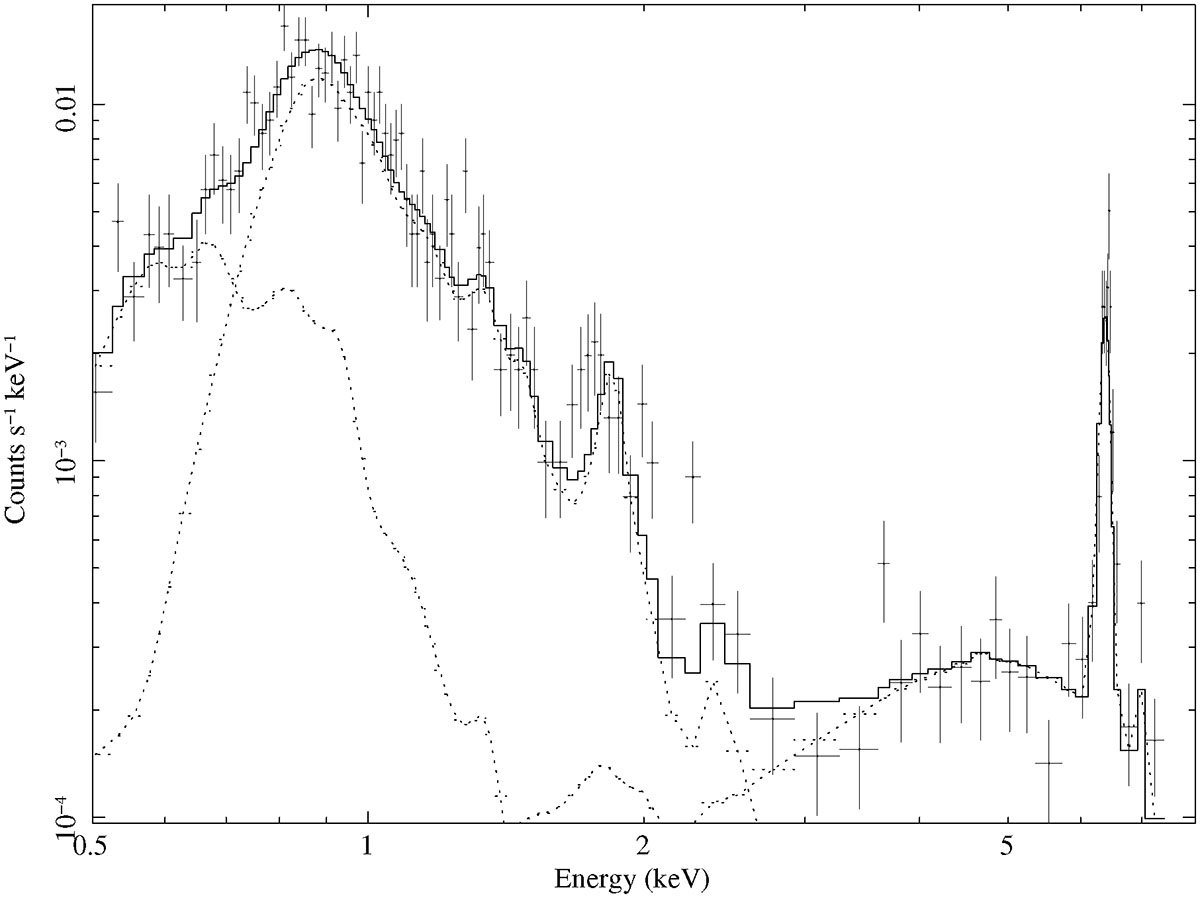
Fig. 7.
Download original image
0.5–8 keV Chandra spectrum of the nucleus of M51 with the best-fit model. The dotted lines in the soft (0.5–2 keV) band show the two thermal components. In the hard (2–8 keV) band the strong Fe Kα is seen which is the tell-tale sign of the reflection dominated continuum. The direct AGN continuum is completely obscured; the reflected continuum is shown with the dotted line.
Current usage metrics show cumulative count of Article Views (full-text article views including HTML views, PDF and ePub downloads, according to the available data) and Abstracts Views on Vision4Press platform.
Data correspond to usage on the plateform after 2015. The current usage metrics is available 48-96 hours after online publication and is updated daily on week days.
Initial download of the metrics may take a while.