


Fig. 6.
Download original image
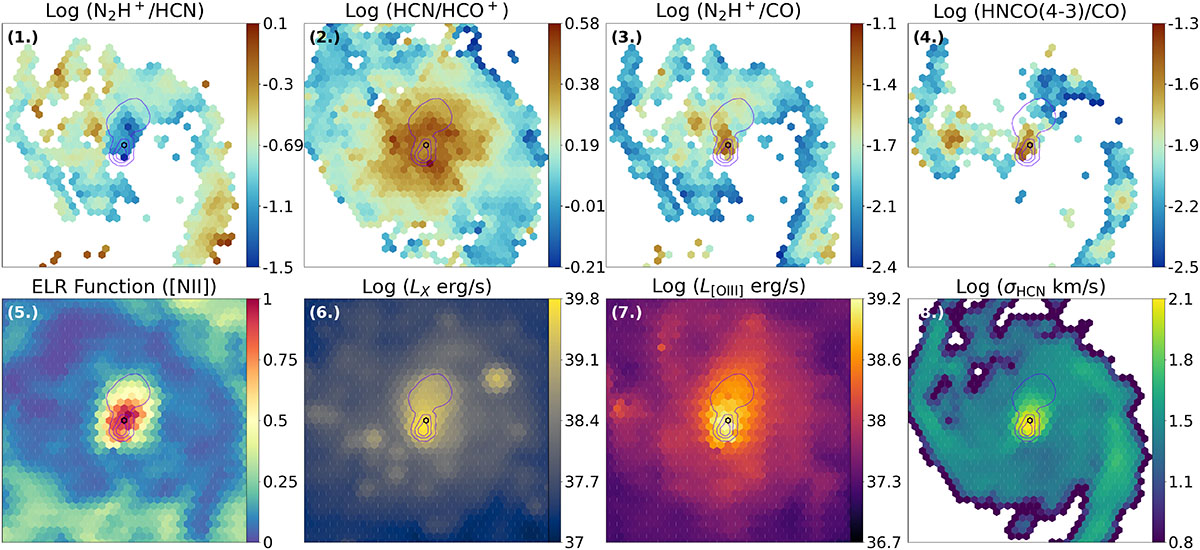
Variety and extent of AGN impact as a function of the chosen indicator. Contours of the 6 cm radio continuum shown for comparison in purple. The pixel that hosts the AGN is circled in black, position provided by Hagiwara & Edwards (2015). Top: (1.) N2H+/HCN ratio, demonstrating where the two dense gas tracers diverge (2.) HCN/HCO+ ratio, traditionally used to distinguish PDRs from XDRs. Generally a ratio value greater than 1 (positive log-scale value) would indicate an XDR, though such values clearly exceed the AGN region here as defined by other indicators. (3.) N2H+/CO, which roughly traces the dense gas fraction, highlighting a potential dense gas outflow near the AGN (4.) HNCO/CO, a shock tracer with large values near the location of the AGN. Within central pixels VENGA resolution struggles to distinguish AGNs from shocks. Bottom: (1.) ELR [NII] function, where orange-red points indicate AGN ionization dominates. (2.) X-ray luminosity from Chandra, note the heightened emission both along the radio lobe and particular south of the AGN. (3.) [OIII]5007 luminosity, with a clear ionized outflow extending north along the radio jet. (4.) The width of a Gaussian fit to the HCN emission line, note these values are highest near the AGN and more compact than all other AGN tracers. Future SWAN works will be devoted to investigating this region at higher resolution in more detail.
Current usage metrics show cumulative count of Article Views (full-text article views including HTML views, PDF and ePub downloads, according to the available data) and Abstracts Views on Vision4Press platform.
Data correspond to usage on the plateform after 2015. The current usage metrics is available 48-96 hours after online publication and is updated daily on week days.
Initial download of the metrics may take a while.