


Fig. 5.
Download original image
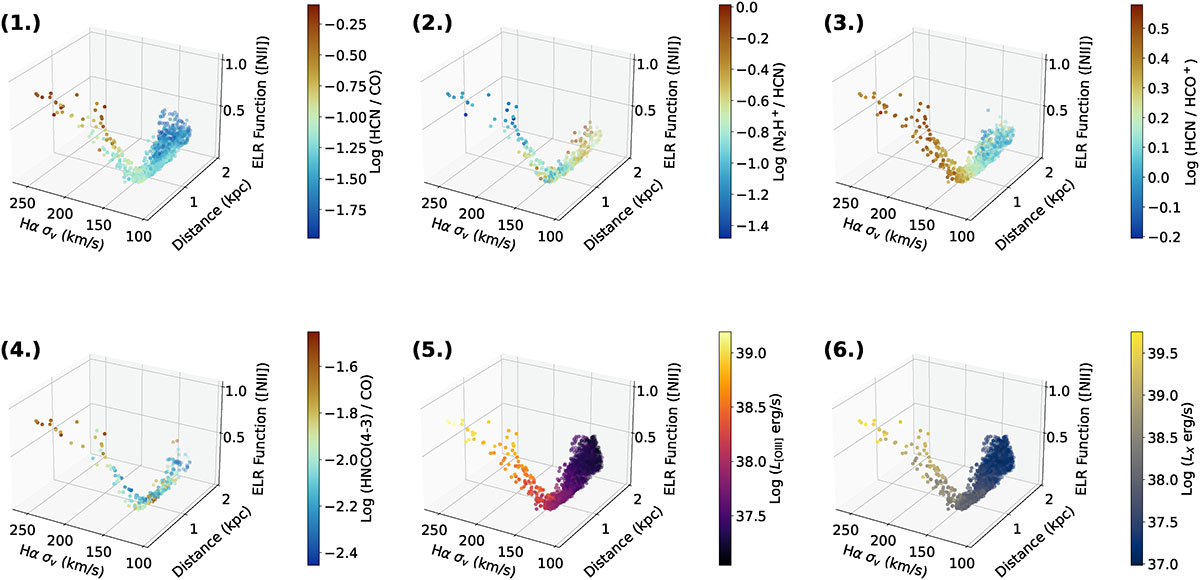
3D BPT diagrams, with axes corresponding to the velocity dispersion of Hα (Hασv in km/s, the distance from the center of the galaxy in kiloparsecs, and the ELR function. Points are color-coded by relevant line ratios. Top: (1.) HCN/CO ratios are largest where the ELR is largest, with a secondary dependency on Hασv, clear evidence of AGN feedback leading to excitation of HCN. (2.) N2H+/HCN ratios drop in the center, but only where ELR exceeds 0.5. These values also correspond to the highest velocity dispersion, meaning shocks cannot be ruled out as an ionizing source. But the lack of correlation between N2H+/HCN and velocity dispersion implies AGN ionization may play a bigger role. (3.) HCN/HCO+, which should traditionally separate AGNs and star formation clearly fails compared to ELR, finding large values even as both ELR and velocity dispersion drop, and ionization from HII regions should dominate. Bottom: (4.) HNCO(4–3)/CO, which traces slow shocks, is greatest where ELR and velocity dispersion are also at their highest, save a region near ∼1 kpc where HNCO(4–3)/CO is large but ELR is low. (5.) [OIII] luminosity, which increases with both ELR and velocity dispersion, decreasing with distance. (6.) X-ray luminosity from Chandra, which exhibits similar trends as L[OIII]. LX and L[OIII] increase more gradually with the ELR, similar to HCN/HCO+, indicating they are sensitive to the overall interstellar radiation field and not AGN feedback alone.
Current usage metrics show cumulative count of Article Views (full-text article views including HTML views, PDF and ePub downloads, according to the available data) and Abstracts Views on Vision4Press platform.
Data correspond to usage on the plateform after 2015. The current usage metrics is available 48-96 hours after online publication and is updated daily on week days.
Initial download of the metrics may take a while.