


Fig. 4.
Download original image
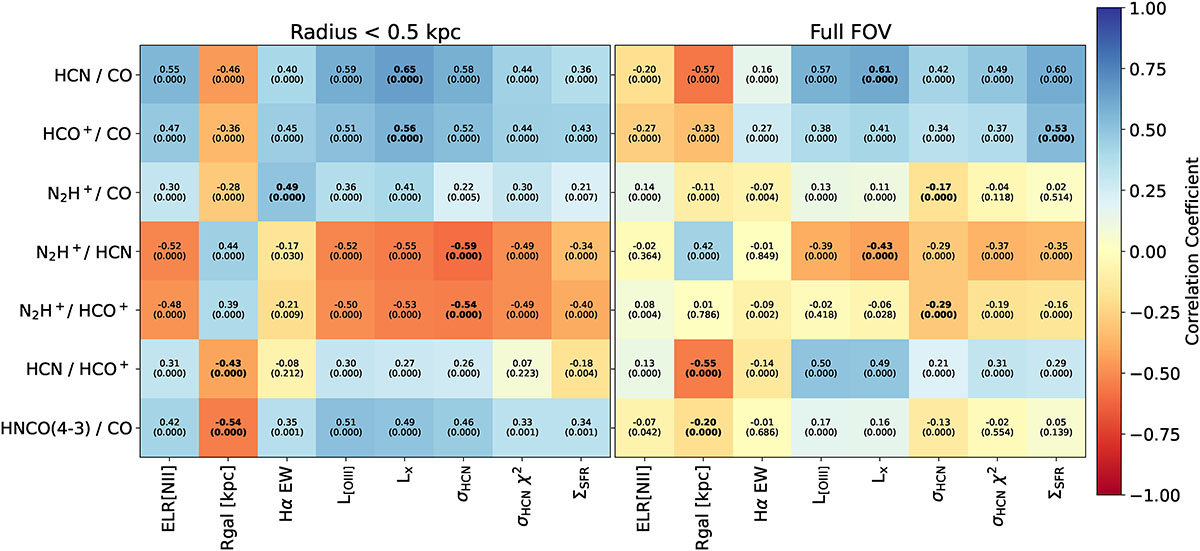
Heat matrix for how well different tracers of AGN activity (x axis) correlate with line ratios from SWAN (y axis). Kendall tau correlation coefficients are shown in each box, and set the color scheme (with blue being highly correlated, red being highly anticorrelated, and yellow showing no correlation). p-values are shown in parentheses below. The strongest correlation for each SWAN line ratio is shown in bold. We consider both the central 0.5 kpc (left), which should contain the observational indicators of the outflow and radio jet, as well as the full field of view (right). Variations in N2H+ emission compared to alternative gas tracers HCN and HCO+ are always highly anticorrelated with tracers of AGN activity in the central 0.5 kpc, with the strongest correlation being the Gaussian width of HCN. These correlations weaken when the full field of view is considered, but HCN/CO and HCO+/CO correlations with AGN tracers remain strong. This points to AGN feedback (in its many forms) influencing the dense gas ratio throughout the SWAN+VENGA FOV, which in turn is highly correlated with ΣSFR.
Current usage metrics show cumulative count of Article Views (full-text article views including HTML views, PDF and ePub downloads, according to the available data) and Abstracts Views on Vision4Press platform.
Data correspond to usage on the plateform after 2015. The current usage metrics is available 48-96 hours after online publication and is updated daily on week days.
Initial download of the metrics may take a while.