


Fig. 3.
Download original image
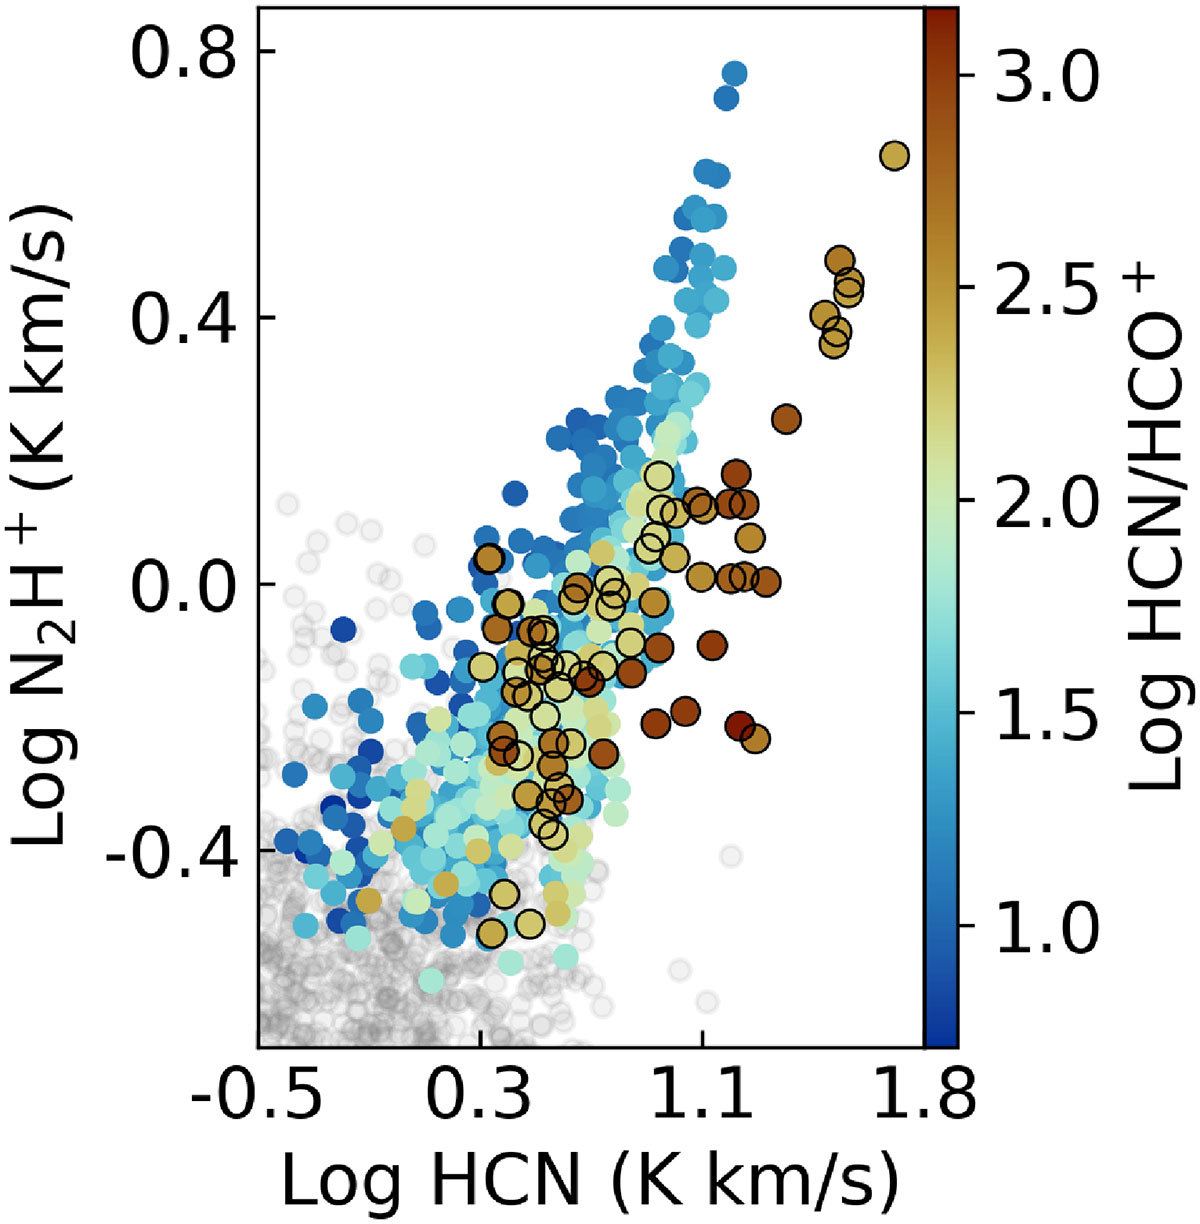
Dense gas relation of N2H+ vs. HCN as shown in Fig. 2, but color-coded by HCN/HCO+. This ratio is an alternative diagnostic for AGN contamination of molecular lines, with a ratio greater than 1.8 usually corresponding to obscured nuclear activity (Kohno 2005). Yet the main correlation between N2H+ (dominated by star-forming pixels) has many pixels with HCN/HCO+ > 1.8. Indeed, the pixels with the largest HCN/HCO+ ratio are not those with the greatest difference from the average trend, but those with a moderate difference but low N2H+ emission. Pixels within the central 0.5 kpc have a dark border, to demonstrate how this ratio decreases far more gradually than the ELR function moving away from the galaxy center.
Current usage metrics show cumulative count of Article Views (full-text article views including HTML views, PDF and ePub downloads, according to the available data) and Abstracts Views on Vision4Press platform.
Data correspond to usage on the plateform after 2015. The current usage metrics is available 48-96 hours after online publication and is updated daily on week days.
Initial download of the metrics may take a while.