


Fig. 2.
Download original image
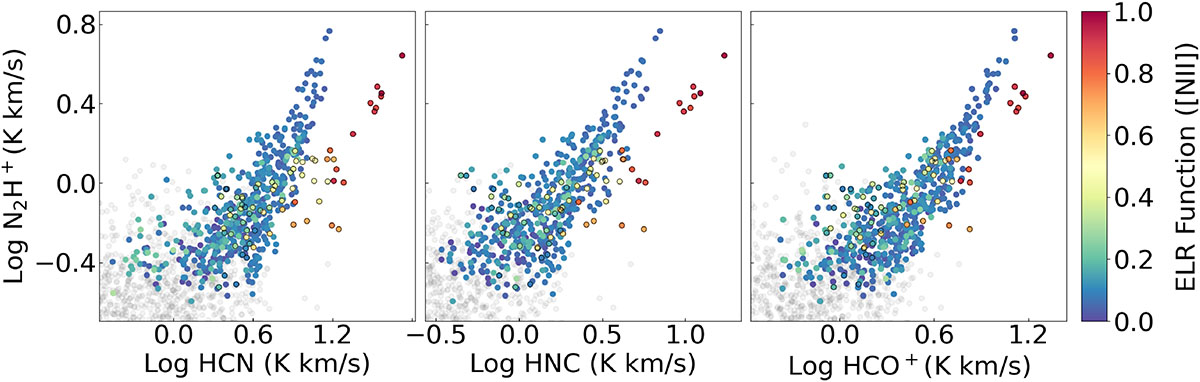
Dense gas relations with N2H+, with alternative dense gas tracers on the x axis, color-coded by the ELR function. Only points with a measurable ELR, which have a S/N greater than three for both lines, are included as colored points. Gray points are the remainder of pixels where the ELR is not measured, and the S/N of one or both emission lines is less than 3. The ELR accurately distinguishes “problem regions” where HCN and HNC no longer function as accurate dense gas tracers. HCO+ is a better dense gas tracer, in agreement with N2H+ up to the most extreme ELR values. Yet even in this case, excluding ELR > 0.75 would ensure the most accurate dense gas estimates, assuming N2H+ remains a viable dense gas tracer in the central regions. Pixels within the central 0.5 kpc have a dark border, for spatial reference.
Current usage metrics show cumulative count of Article Views (full-text article views including HTML views, PDF and ePub downloads, according to the available data) and Abstracts Views on Vision4Press platform.
Data correspond to usage on the plateform after 2015. The current usage metrics is available 48-96 hours after online publication and is updated daily on week days.
Initial download of the metrics may take a while.