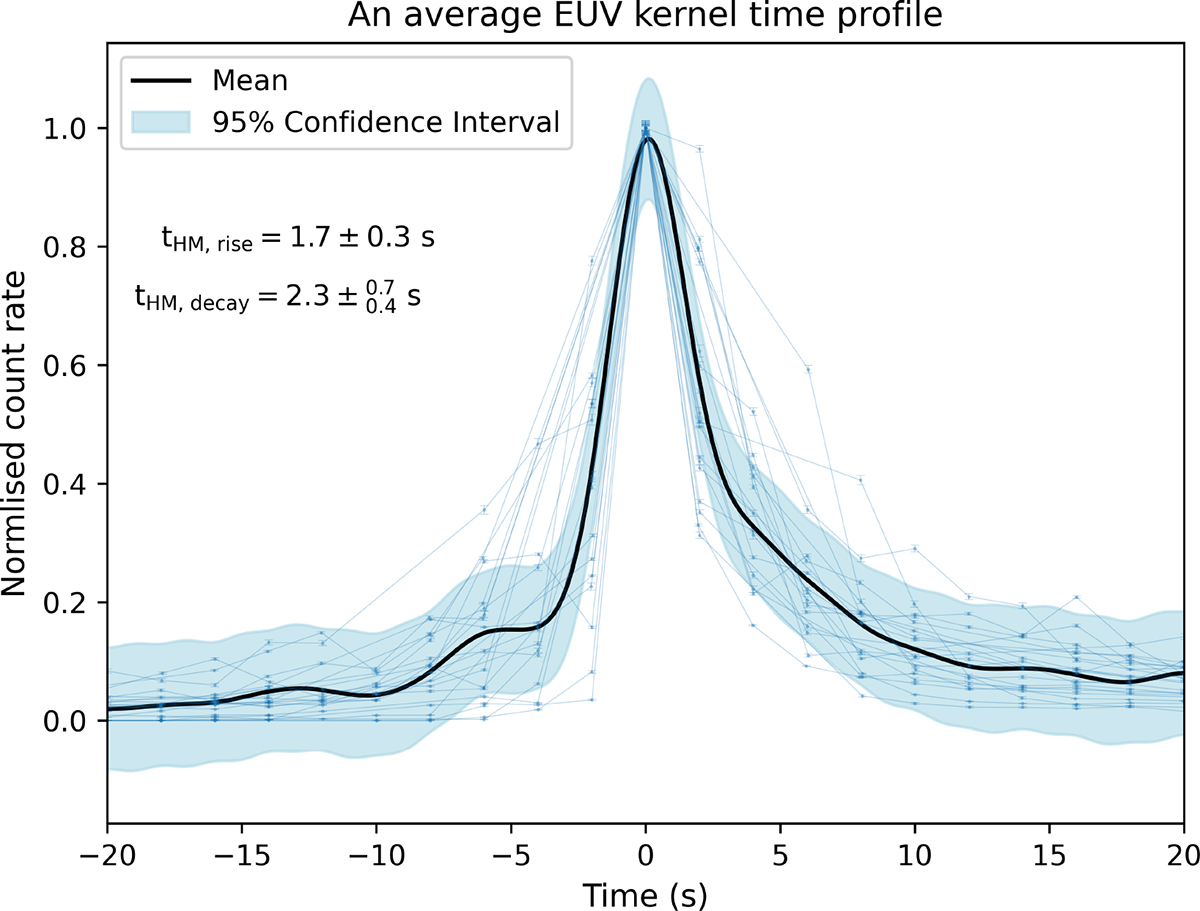
Fig. 7.
Download original image
Normalised time profiles of 25 individual kernels fitted using Gaussian process regression. To identify the kernels, a threshold of 50% Imax was applied in order to exclude the fainter EUV kernel pixels. The light curves of individual EUV kernels are plotted below. The fit gives short rise and decay times of thalf-max, rise = 1.7 ± 0.3 s and ![]() , respectively.
, respectively.
Current usage metrics show cumulative count of Article Views (full-text article views including HTML views, PDF and ePub downloads, according to the available data) and Abstracts Views on Vision4Press platform.
Data correspond to usage on the plateform after 2015. The current usage metrics is available 48-96 hours after online publication and is updated daily on week days.
Initial download of the metrics may take a while.