Fig. 5.
Download original image
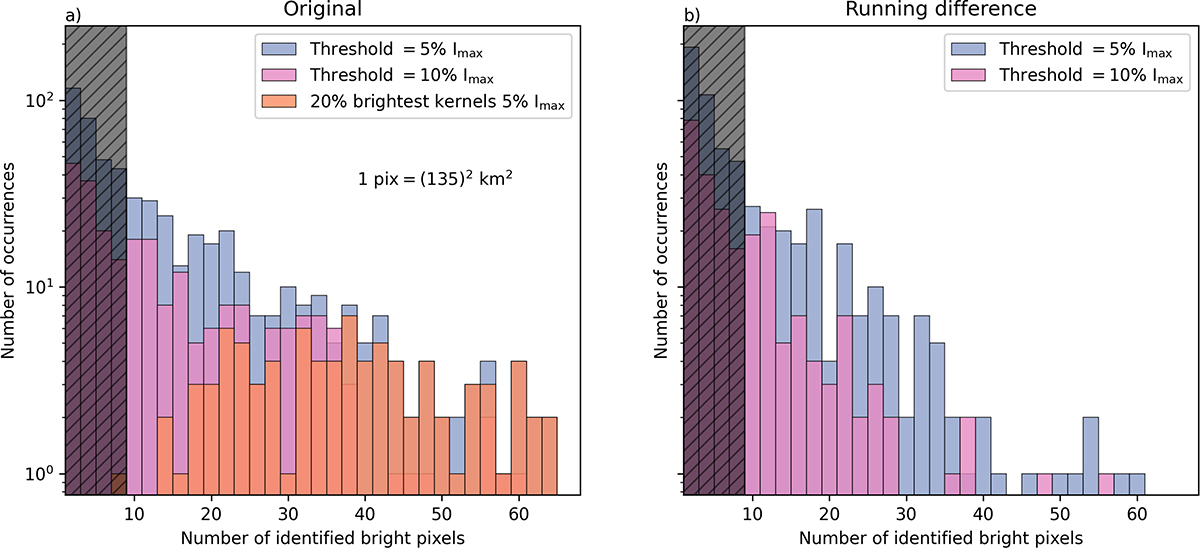
Kernel size histograms showing the number of bright pixels identified in a kernel using the watershed method with two different thresholds applied to both the original and the running difference data. These distributions demonstrate that a significant fraction of kernels were unresolved and that the brightest kernels have sizes that are on the order of the instrument’s PSF. The characterisation of faint kernels depends strongly on the threshold applied, and their sizes are thus somewhat ambiguous. The vertical shaded area masks kernels whose size estimates are unreliable due to artificial shrinkage caused by data thresholding.
Current usage metrics show cumulative count of Article Views (full-text article views including HTML views, PDF and ePub downloads, according to the available data) and Abstracts Views on Vision4Press platform.
Data correspond to usage on the plateform after 2015. The current usage metrics is available 48-96 hours after online publication and is updated daily on week days.
Initial download of the metrics may take a while.