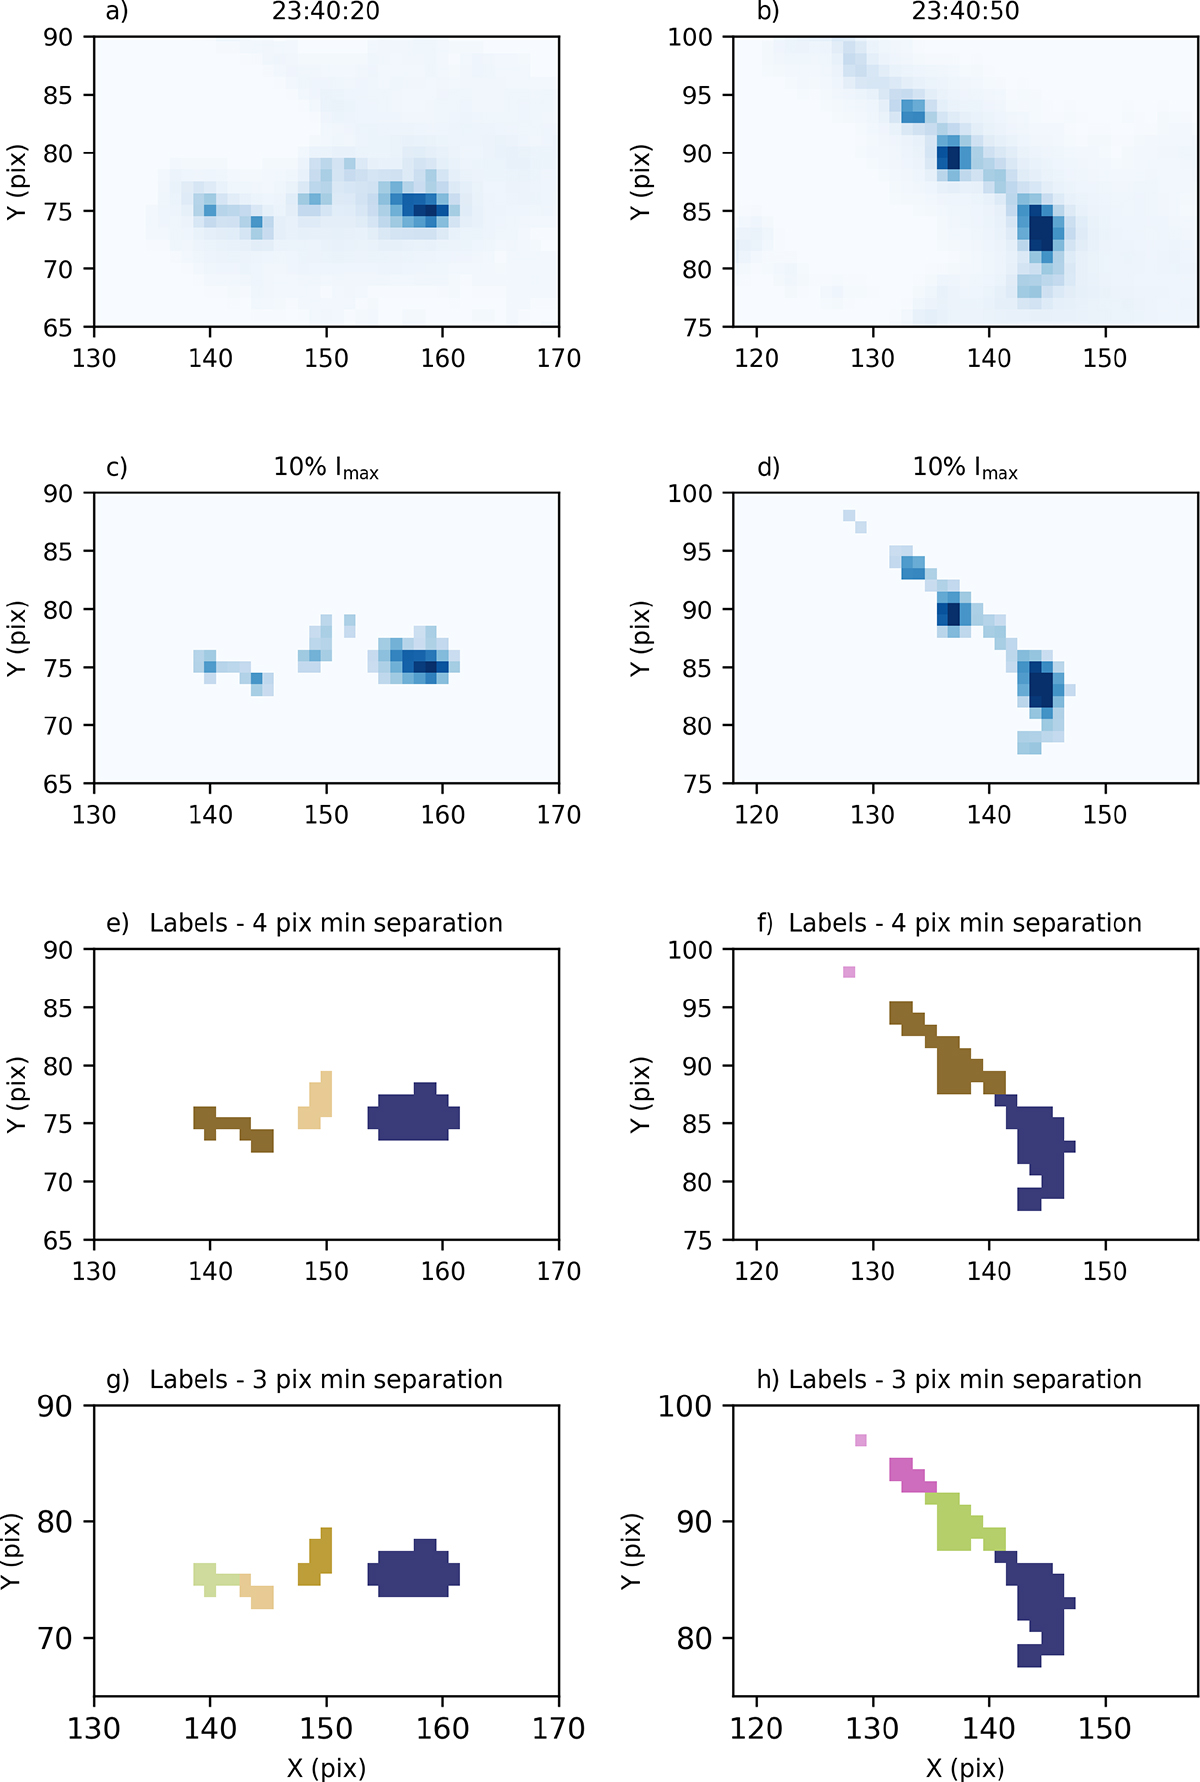
Fig. 4.
Download original image
Examples of kernels identified using the watershed method in two frames at 23:40:20 UT and 23:40:50 UT. The first row shows the raw data measured by HRIEUV. The second row shows the data after the 10% Imax threshold has been applied. Rows three and four show the labels that were output by the watershed segmentation method when a minimum marker separation of 4 and 3 pixels was used, respectively.
Current usage metrics show cumulative count of Article Views (full-text article views including HTML views, PDF and ePub downloads, according to the available data) and Abstracts Views on Vision4Press platform.
Data correspond to usage on the plateform after 2015. The current usage metrics is available 48-96 hours after online publication and is updated daily on week days.
Initial download of the metrics may take a while.