Fig. 3.
Download original image
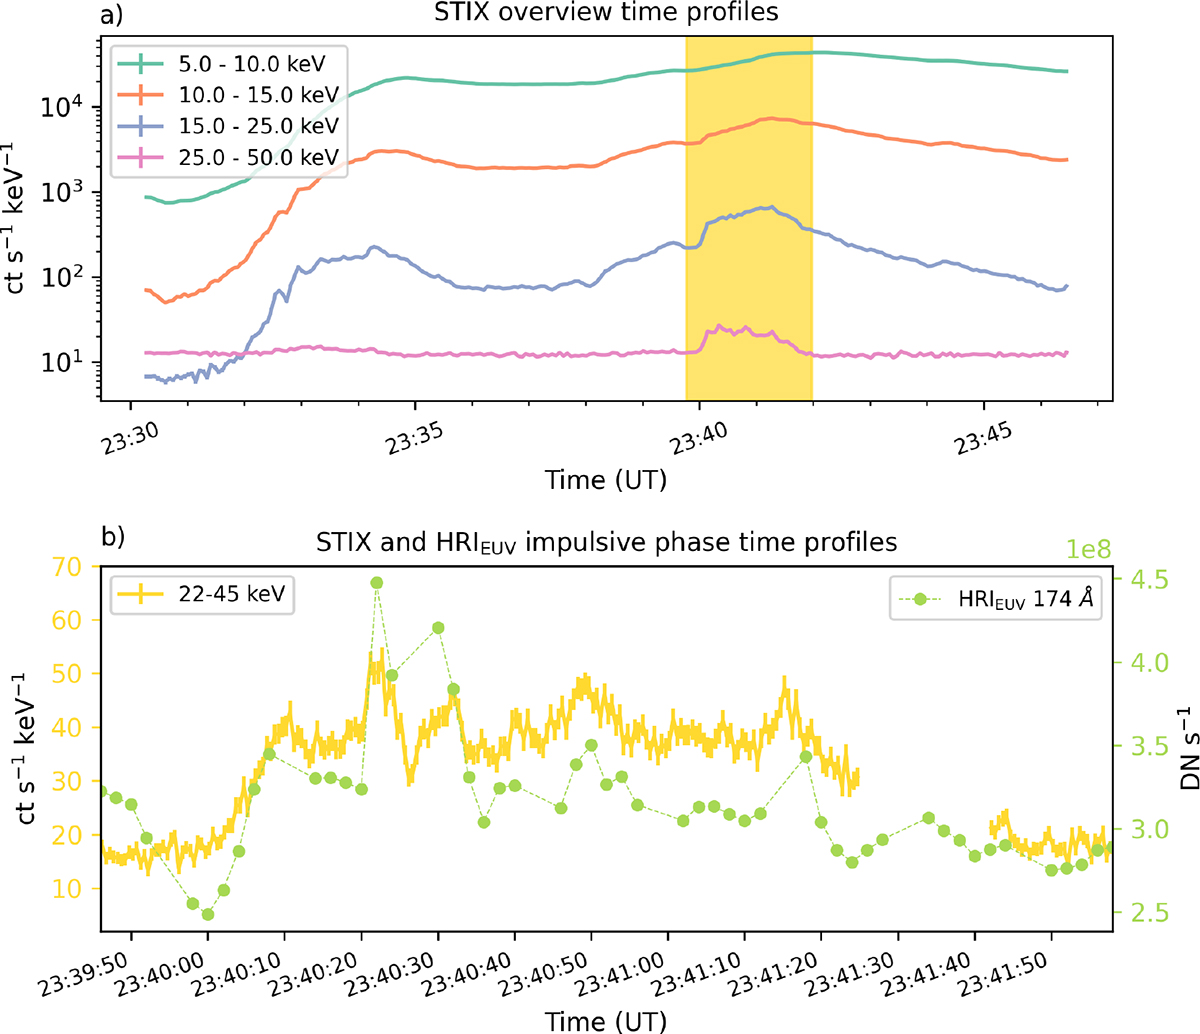
Overview time profiles of the M2.5 GOES-class flare SOL2024-03-23T23:41. Panel (a): STIX light curves for the entire flare. Panel (b): Zoomed-in image of the high-energy X-ray profiles (22–45 keV) compared to the 174 Å spatially integrated (over the ROI shown in Fig. 2) short-exposure time profile. The short-exposure EUV data was taken at 2 s cadence with 6 s gaps every six frames. The correspondence between hard X-ray and EUV emission is notable. The associated movie is available online.
Current usage metrics show cumulative count of Article Views (full-text article views including HTML views, PDF and ePub downloads, according to the available data) and Abstracts Views on Vision4Press platform.
Data correspond to usage on the plateform after 2015. The current usage metrics is available 48-96 hours after online publication and is updated daily on week days.
Initial download of the metrics may take a while.