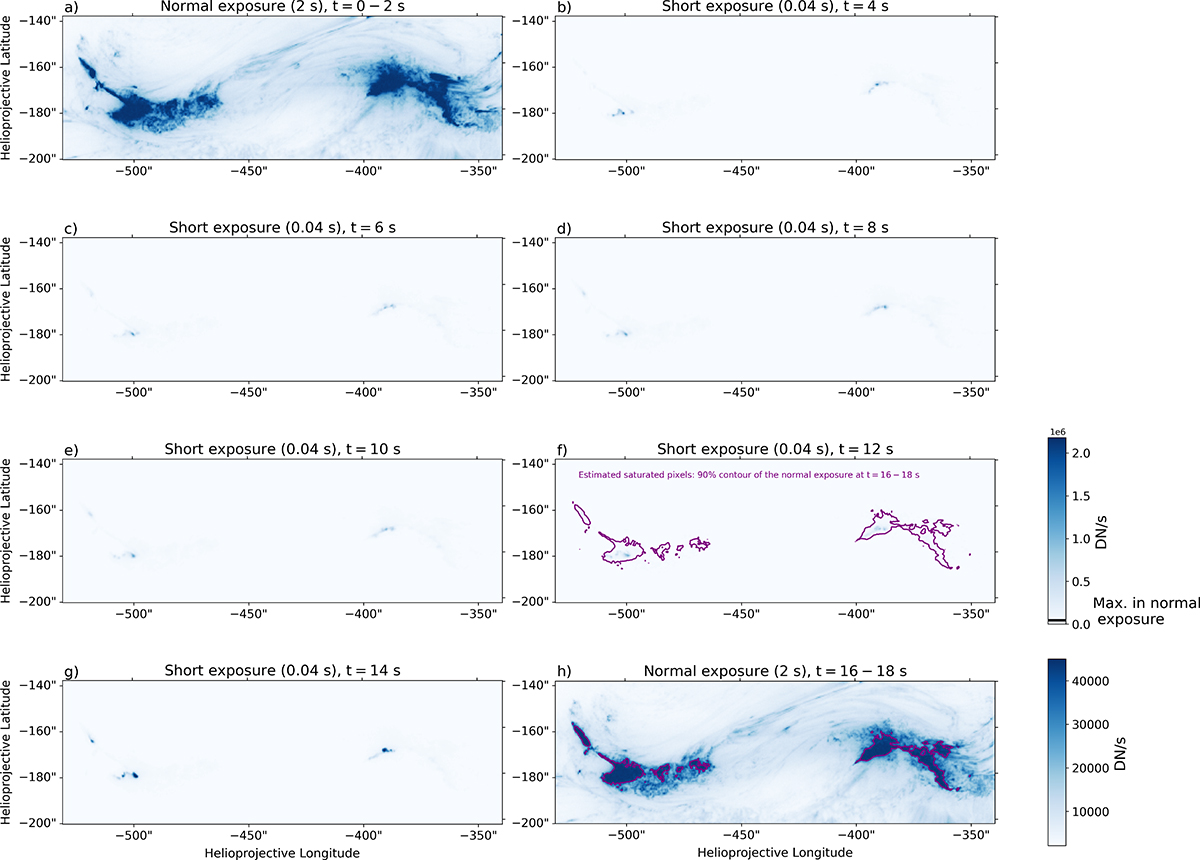
Fig. 2.
Download original image
Normal exposure frame taken at 2024-03-23 23:40:10 UT (t = 0), followed by six short exposures, and finally a normal exposure when the cycle repeated. The first and last frames highlight the saturation levels reached in the active region during the main flare energy release. The short exposures highlight the small scale of the EUV kernels within the otherwise fully saturated flare ribbons. All colour maps are linearly scaled, with the short-exposure frames normalised to the maximum intensity at t = 14 s and the normal exposures scaled to the saturation value. The associated movie is available online.
Current usage metrics show cumulative count of Article Views (full-text article views including HTML views, PDF and ePub downloads, according to the available data) and Abstracts Views on Vision4Press platform.
Data correspond to usage on the plateform after 2015. The current usage metrics is available 48-96 hours after online publication and is updated daily on week days.
Initial download of the metrics may take a while.