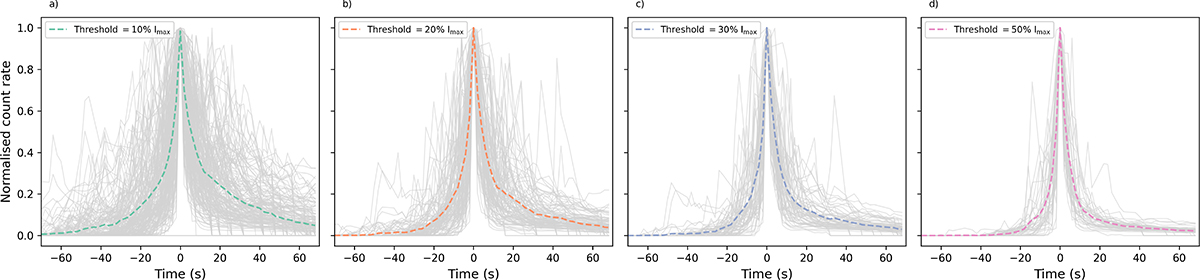
Fig. C.1.
Download original image
Average time profiles of EUV kernels given different kernel identification thresholds. The individual kernel light curves are shown in light grey. There is a significant amount of temporal variation around the main peak in many profiles. This indicates that there is fine structure in the energy release process and the average profile provides an approximate upper bound on the overall duration of a single burst.
Current usage metrics show cumulative count of Article Views (full-text article views including HTML views, PDF and ePub downloads, according to the available data) and Abstracts Views on Vision4Press platform.
Data correspond to usage on the plateform after 2015. The current usage metrics is available 48-96 hours after online publication and is updated daily on week days.
Initial download of the metrics may take a while.