Fig. 8.
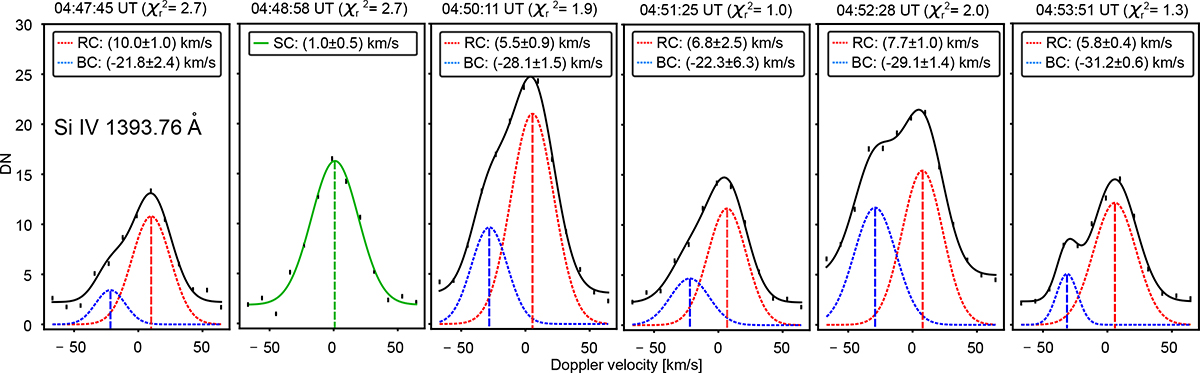
Download original image
Spectra averaged over the region enclosed by a rectangle in green displayed in Fig. 7, centered around Si IV 1393.76 Å. The spectra are displayed for six times around the apparent starting time of E7 at 04:50 UT. We apply a fitting with a single Gaussian to the spectrum at 04:48:58 UT called single component (SC); and a fitting with two Gaussian functions to the other spectra, called the red (RC) and the blue component (BC). The resulting velocity and uncertainty is written for each component in the legends. The vertical dashed lines indicate the locations in Doppler velocities of the peaks for the two components. The indicated times are the central times of the IRIS fast rasters. The χr2 value resulting from each fit is indicated next to the time in UT for each spectrum.
Current usage metrics show cumulative count of Article Views (full-text article views including HTML views, PDF and ePub downloads, according to the available data) and Abstracts Views on Vision4Press platform.
Data correspond to usage on the plateform after 2015. The current usage metrics is available 48-96 hours after online publication and is updated daily on week days.
Initial download of the metrics may take a while.