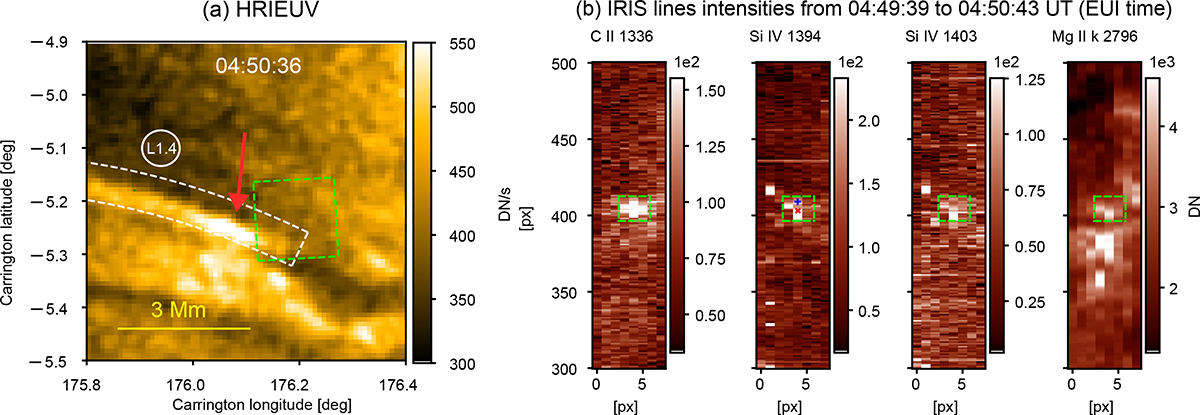
Fig. 7.
Download original image
Chromospheric and TR line intensities at the time of event E7 (Fig. 6d). Left: Image of HRIEUV (04:50:36 UT) showing slit L1.4 (white dotted region) and the intensity peak associated with E7 (indicated by a red arrow). Right: Spectrally summed images of four UV lines over [−110, 110] km s−1 measured with IRIS. The HRIEUV and IRIS images are zoomed-in around the locations of E7 and slit L1.4. The rectangles in green correspond to the same spatial region in Carrington coordinates (a) and in IRIS pixels coordinates (b). The spectra in Fig. 8 are spatially averaged over the region enclosed by the rectangle in green shown in the HRIEUV and IRIS images. The blue cross and the red star displayed in the Si IV 1394 Å images are the pixels over which the spectra at 04:50:11 UT are displayed in Fig. 9.
Current usage metrics show cumulative count of Article Views (full-text article views including HTML views, PDF and ePub downloads, according to the available data) and Abstracts Views on Vision4Press platform.
Data correspond to usage on the plateform after 2015. The current usage metrics is available 48-96 hours after online publication and is updated daily on week days.
Initial download of the metrics may take a while.