Fig. 5.
Download original image
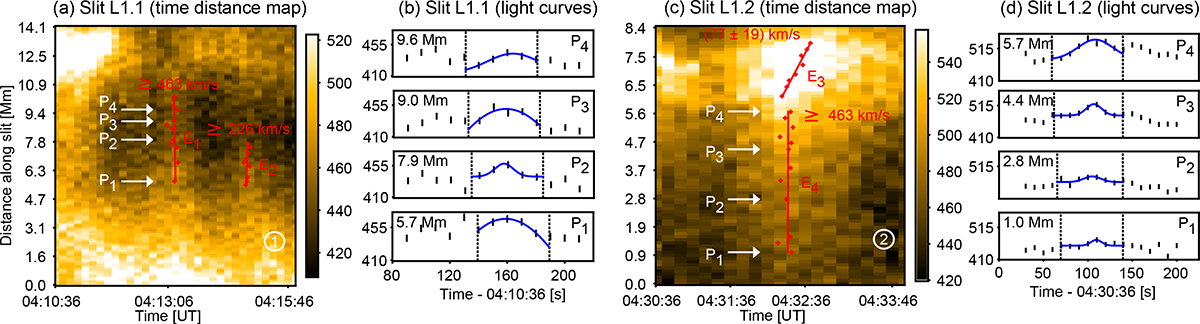
Time-distance maps (a and c) along slits L1.1 and L1.2 (Figs. 4a and 4b). The number of each slit is shown as a white circle in the bottom-right side. The intensity motions of interest are the events E1 to E4. The red crosses show the times of the intensity peaks associated with the events at different locations. The red line represents the computed PoS velocity on the time-distance map for each event. Panels (b) and (d) show four examples of light curves at distinct locations (noted P1 to P4) at the times of E1 and E4, respectively. The vertical dotted lines represent the time intervals that include the intensity peak. A Gaussian function (in blue) is fitted to estimate the central time of the intensity peak (see Appendix A for more details). The events E1, E2 and E4 seem to appear almost instantaneously along the slit, within the limitations due to the HRIEUV temporal resolution. In that case, we only show the highest resolvable PoS velocity as a lower limit. The intensity values are in DN/s.
Current usage metrics show cumulative count of Article Views (full-text article views including HTML views, PDF and ePub downloads, according to the available data) and Abstracts Views on Vision4Press platform.
Data correspond to usage on the plateform after 2015. The current usage metrics is available 48-96 hours after online publication and is updated daily on week days.
Initial download of the metrics may take a while.