Fig. 4.
Download original image
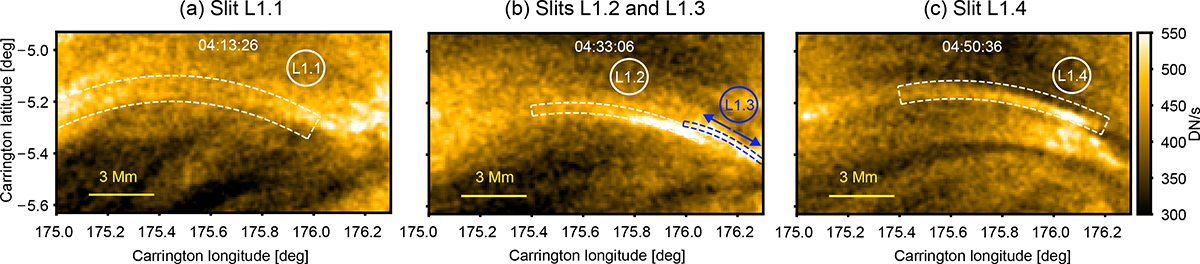
HRIEUV images zoomed-in to the right footpoint of loop bundle 1, showing (a) slit L1.1 at 04:13:26 UT, (b) slits L1.2 and L1.3 at 04:33:06 UT, and (c) slit L1.4 at 04:50:36 UT. The slits are displayed as either white or blue dotted lines. The blue arrows above slit 3 highlight am apparent bi-directional motion of intensity peaks. The associated movies are available online.
Current usage metrics show cumulative count of Article Views (full-text article views including HTML views, PDF and ePub downloads, according to the available data) and Abstracts Views on Vision4Press platform.
Data correspond to usage on the plateform after 2015. The current usage metrics is available 48-96 hours after online publication and is updated daily on week days.
Initial download of the metrics may take a while.