Fig. 2.
Download original image
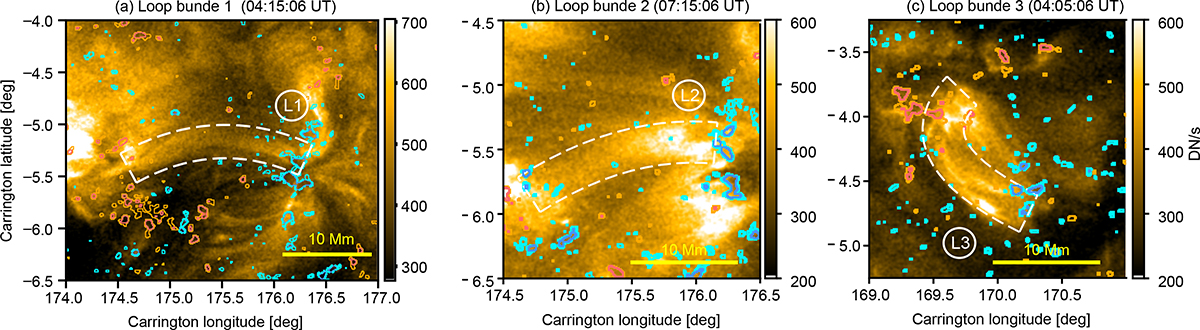
Location of the slits for the three loop bundles. HRIEUV images with a FOV centered around (a) loop bundle 1 at 04:15:06 UT, (b) loop bundle 2 at 07:15:06 UT, (c) and loop bundle 3 at 04:05:06 UT. The Blos/μ values measured by PHI-HRT closest in time are shown as dark orange (Blos/μ> 50 G), light orange (30 G > Blos/μ ≥ 50 G), light blue (−30 G > Blos/μ > −50 G), and dark blue contours (−50 G > Blos/μ). The slits along which the time-distance maps are computed are shown as dashed white lines. The slits are named L1, L2, and L3 for loop bundles 1, 2, and 3, respectively. The yellow bar in the bottom right corner of each panel represents 10 Mm and is shown as a reference. The associated movie for L1 is available online.
Current usage metrics show cumulative count of Article Views (full-text article views including HTML views, PDF and ePub downloads, according to the available data) and Abstracts Views on Vision4Press platform.
Data correspond to usage on the plateform after 2015. The current usage metrics is available 48-96 hours after online publication and is updated daily on week days.
Initial download of the metrics may take a while.