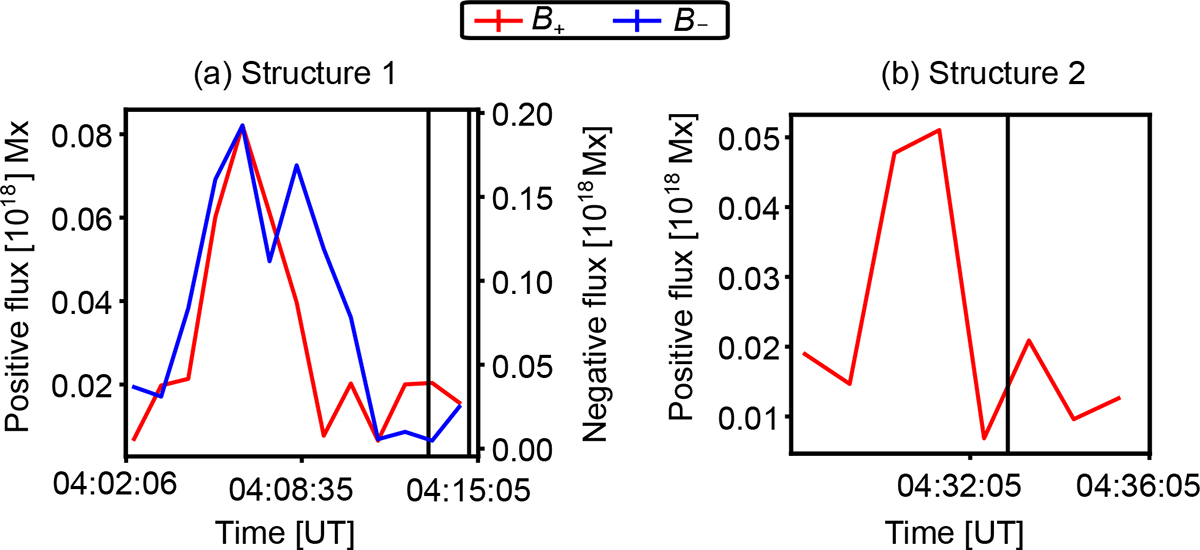
Fig. 12.
Download original image
Positive (B+) and negative (B−) magnetic flux spatially summed over the region enclosed by the green rectangle displayed in Figs. 10 and 11. The selected pixels of each region are those above the 3σ Stokes-V noise threshold (Appendix B). The vertical black lines indicate the time when EUV emission enhancements are detected with HRIEUV: E1 and E2 for (a); E4 for (b).
Current usage metrics show cumulative count of Article Views (full-text article views including HTML views, PDF and ePub downloads, according to the available data) and Abstracts Views on Vision4Press platform.
Data correspond to usage on the plateform after 2015. The current usage metrics is available 48-96 hours after online publication and is updated daily on week days.
Initial download of the metrics may take a while.