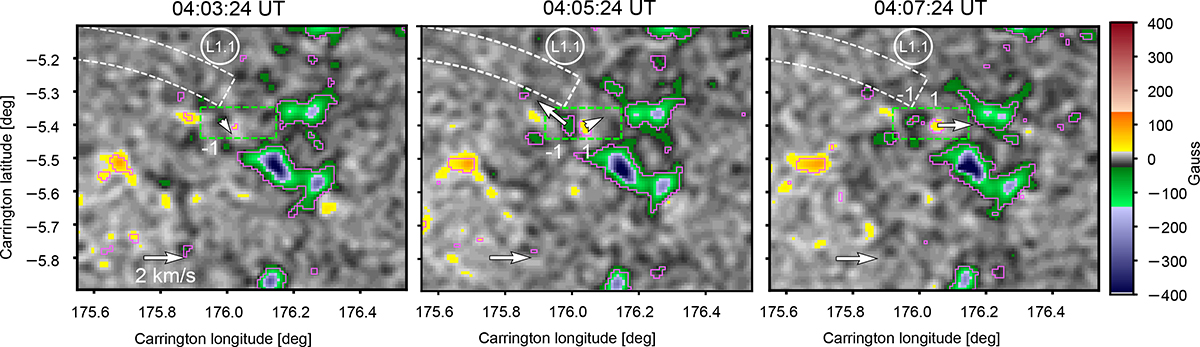
Fig. 10.
Download original image
Images of Blos/μ obtained from PHI-HRT at times close to the EUV emission enhancement measured with slit L1.1 (Fig. 4a). The FOV is zoomed in to the right footpoint of the loop bundle 1. The arrows show the photospheric velocity vectors for magnetic structures of interest detected with SOFT (see Sect. 3.4 for more details). The length of the arrows depends on the velocity norm, and an arrow representing 2 km s−1 is shown as reference in the lower left part of the plot. We show two structures of interest named 1 and −1. The dotted green rectangle shows the region in which the signed flux is measured (Fig. 12a). The pink contours indicate the 4σ confidence level computed from the noise on the Stokes-V parameter (Appendix B).
Current usage metrics show cumulative count of Article Views (full-text article views including HTML views, PDF and ePub downloads, according to the available data) and Abstracts Views on Vision4Press platform.
Data correspond to usage on the plateform after 2015. The current usage metrics is available 48-96 hours after online publication and is updated daily on week days.
Initial download of the metrics may take a while.