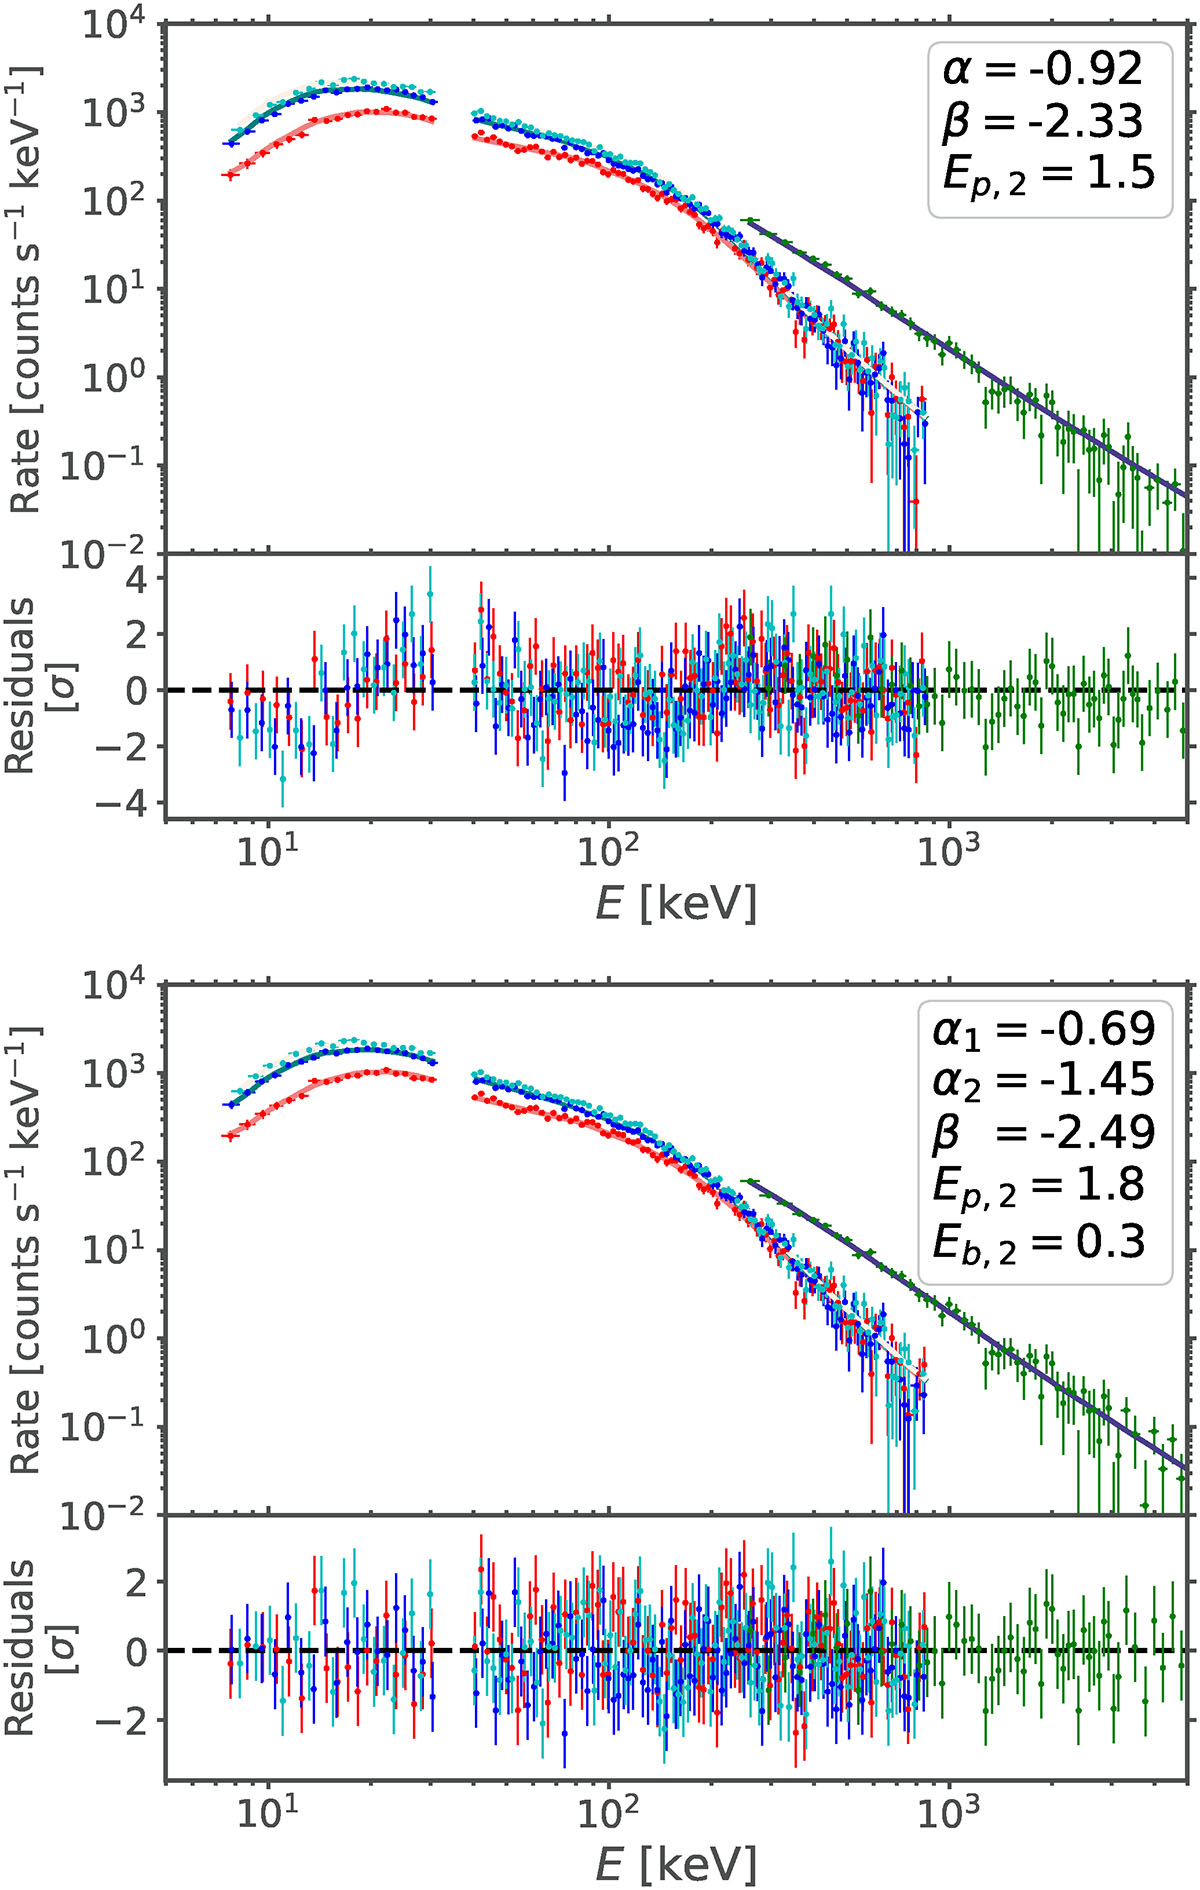
Fig. 6.
Download original image
Comparison of a Band function fit (top) and a 2SBPL fit (bottom) to the time-integrated spectrum with S/N = 300. The red, blue, cyan, and green data points in the count spectrum show the three NaI detectors and the one BGO detector used for the fit, respectively. It is clear from the uneven residuals in the top panel that the Band function did not produce a satisfactory fit. The 2SBPL function performed much better in this region of high S/N, being statistically preferred with ΔAIC = 114. The best-fit Band parameters were α = −0.92 ± 0.02, β = −2.33 ± 0.02, and Ep = 152 ± 4 keV, and the best-fit 2SBPL were α1 = −0.69 ± 0.06, α2 = −1.45 ± 0.04, β = −2.49 ± 0.04, Ep = 178 ± 7 keV, Eb = 27 ± 3 keV.
Current usage metrics show cumulative count of Article Views (full-text article views including HTML views, PDF and ePub downloads, according to the available data) and Abstracts Views on Vision4Press platform.
Data correspond to usage on the plateform after 2015. The current usage metrics is available 48-96 hours after online publication and is updated daily on week days.
Initial download of the metrics may take a while.