Fig. 5.
Download original image
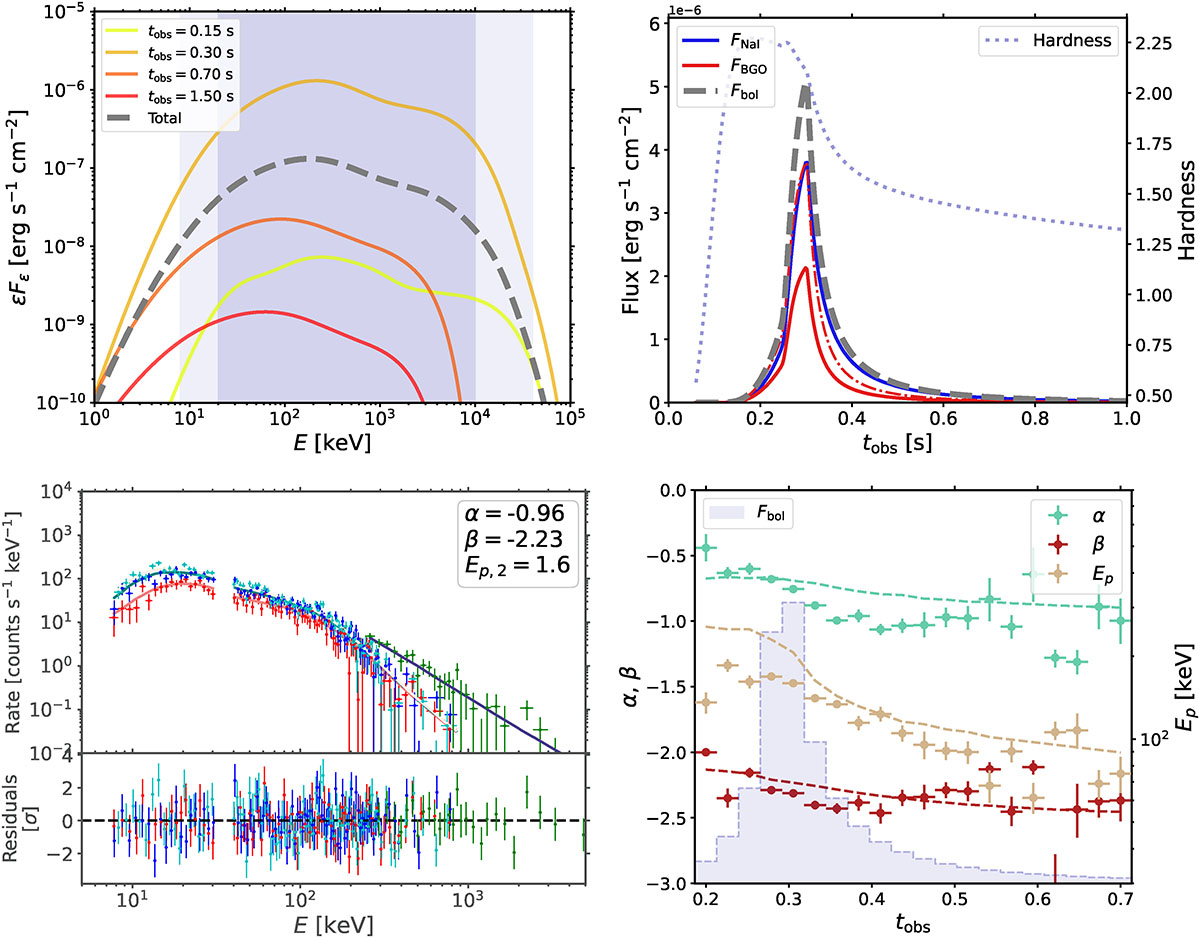
Observed spectral evolution (top left), light curve (top right), count spectrum of a Band fit to the time-integrated spectrum (bottom left), and the evolution of the best-fit Band parameters (bottom right). The dashed grey line in the top-left panel shows the time-integrated spectrum taken as the average over the first second of observations, and purple shading shows the energy range of the GBM, with the darker colour indicating the region with the highest effective area. The dot-dashed red line in the light curve shows the light curve in the BGO band scaled to the peak of the NaI light curve to highlight the difference between the two. The red, blue, cyan, and green data points in the count spectrum show the three NaI detectors and the one BGO detector used for the fit, respectively. The best-fit peak energy is given in units Ep, 2 = Ep/100 keV, and the mock dataset for the fit had a S/N = 50. The best-fit parameters with errors for the time-integrated spectrum were α = −0.96 ± 0.06, β = −2.23 ± 0.09, and Ep = 156 ± 16 keV. All errors given represent 1σ. The simulation parameters are given in Table 1.
Current usage metrics show cumulative count of Article Views (full-text article views including HTML views, PDF and ePub downloads, according to the available data) and Abstracts Views on Vision4Press platform.
Data correspond to usage on the plateform after 2015. The current usage metrics is available 48-96 hours after online publication and is updated daily on week days.
Initial download of the metrics may take a while.