Fig. 2.
Download original image
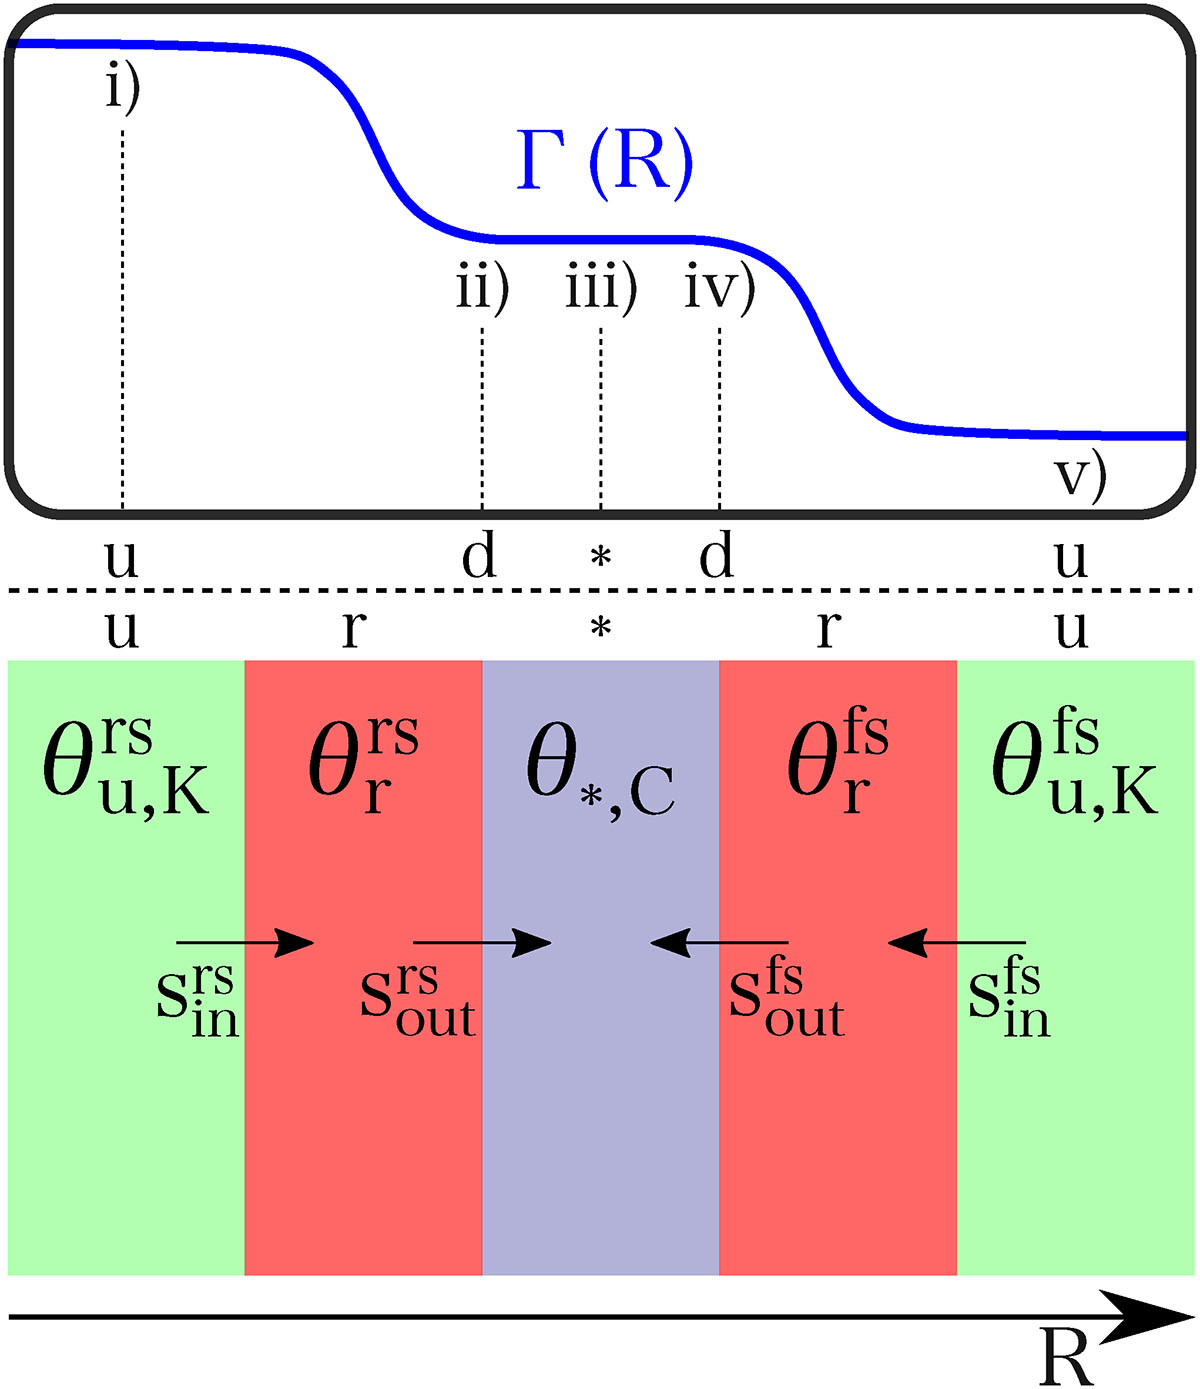
Top panel: Sketch of the Lorentz factor profile across the ejecta with the positions of the five different regions mentioned in subsection 2.4 marked. The dashed vertical lines indicate the position of each region relative to the KRA zones given in the bottom panel. Bottom panel: Geometry of the KRA with both reverse and forward shocks included. Green, red, and purple colours indicate the upstream zones, the RMS zones, and the common downstream zone, respectively. The zones are coupled via source terms as indicated in the figure. The RMS and downstream zones are evolved using the Kompaneets equation (Equation (C.2)) while the upstream zones are assumed to be in a thermal Wien distribution. The relevant temperature in each zone is given. This panel is adapted from Samuelsson et al. (2022), which shows the geometry of the KRA with three zones. In between the two panels, the subscripts used to refer to the different regions and zones are shown for clarity.
Current usage metrics show cumulative count of Article Views (full-text article views including HTML views, PDF and ePub downloads, according to the available data) and Abstracts Views on Vision4Press platform.
Data correspond to usage on the plateform after 2015. The current usage metrics is available 48-96 hours after online publication and is updated daily on week days.
Initial download of the metrics may take a while.