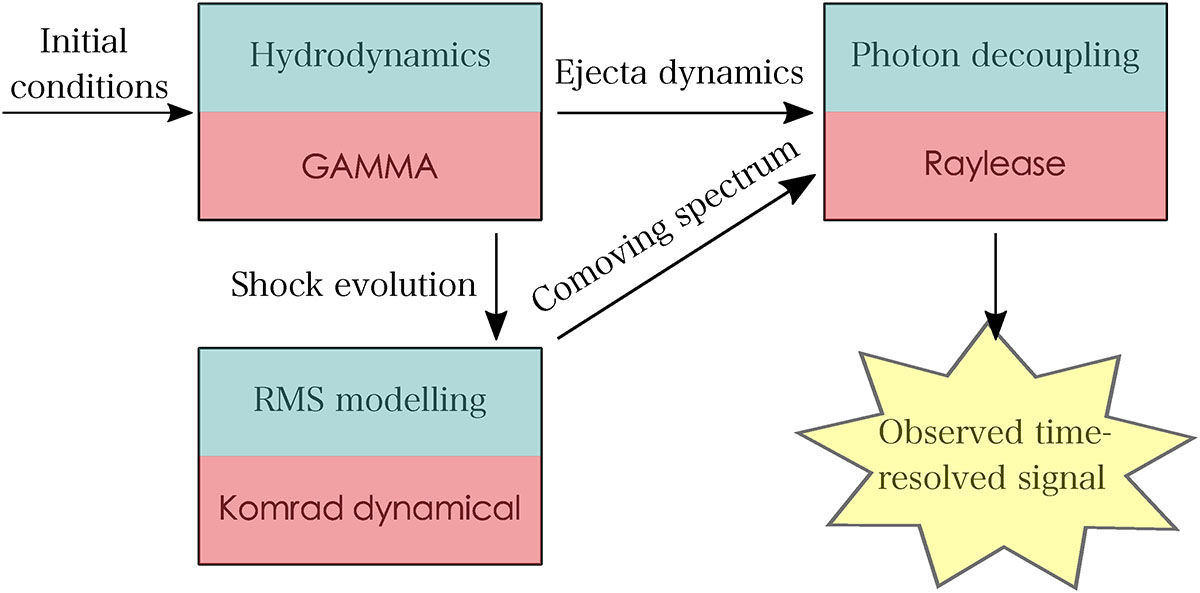
Fig. 1.
Download original image
Flowchart showing the methodology of the paper. Each box shows one step of the chain, with the treated physics given in light blue and the simulation code used given in red. The final result is the time-resolved signal in the observer frame. The hydrodynamics are explained in Section 2, the RMS modelling in Section 3, and the photon decoupling in Section 4. The observed time-resolved signal is shown in Section 5.
Current usage metrics show cumulative count of Article Views (full-text article views including HTML views, PDF and ePub downloads, according to the available data) and Abstracts Views on Vision4Press platform.
Data correspond to usage on the plateform after 2015. The current usage metrics is available 48-96 hours after online publication and is updated daily on week days.
Initial download of the metrics may take a while.