Open Access
Fig. A.2
Download original image
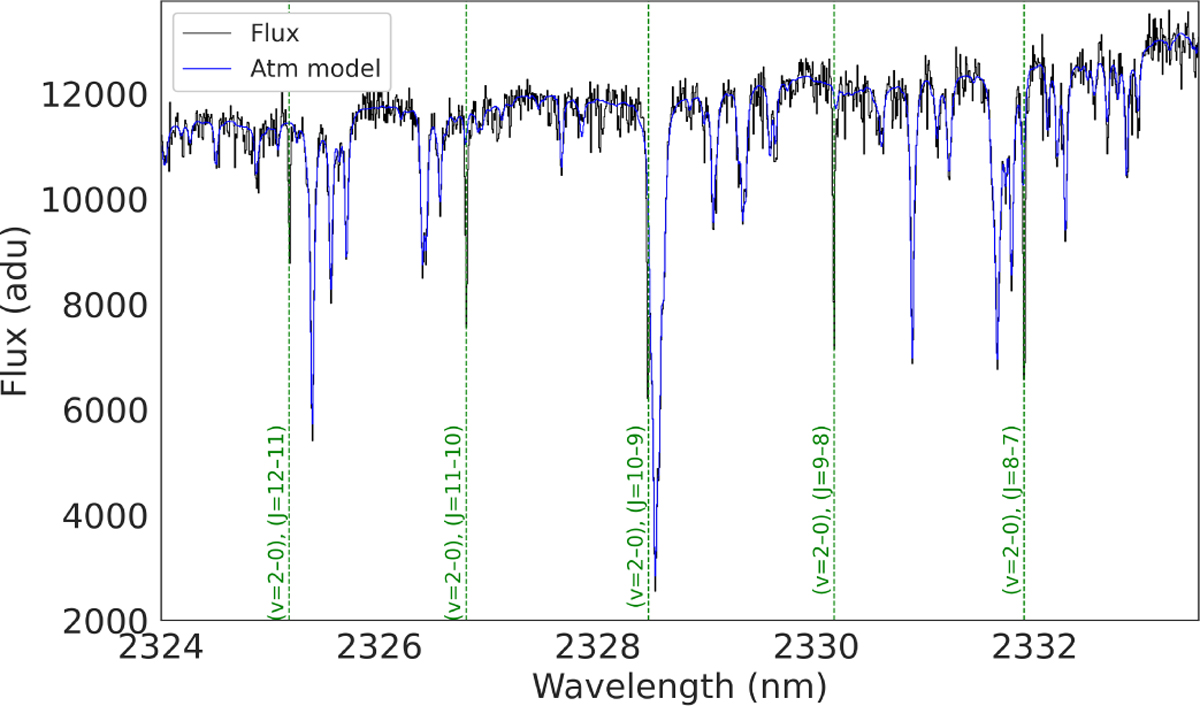
Portion of an example spectrum (black) overlaid with the telluric fit (blue) produced by molecfit over the data from a single nodding position/day combination (the combined nodding A frames on the night of 08/03/2024). The locations of 12CO lines are marked with green dashed lines.
Current usage metrics show cumulative count of Article Views (full-text article views including HTML views, PDF and ePub downloads, according to the available data) and Abstracts Views on Vision4Press platform.
Data correspond to usage on the plateform after 2015. The current usage metrics is available 48-96 hours after online publication and is updated daily on week days.
Initial download of the metrics may take a while.