Fig. A.1
Download original image
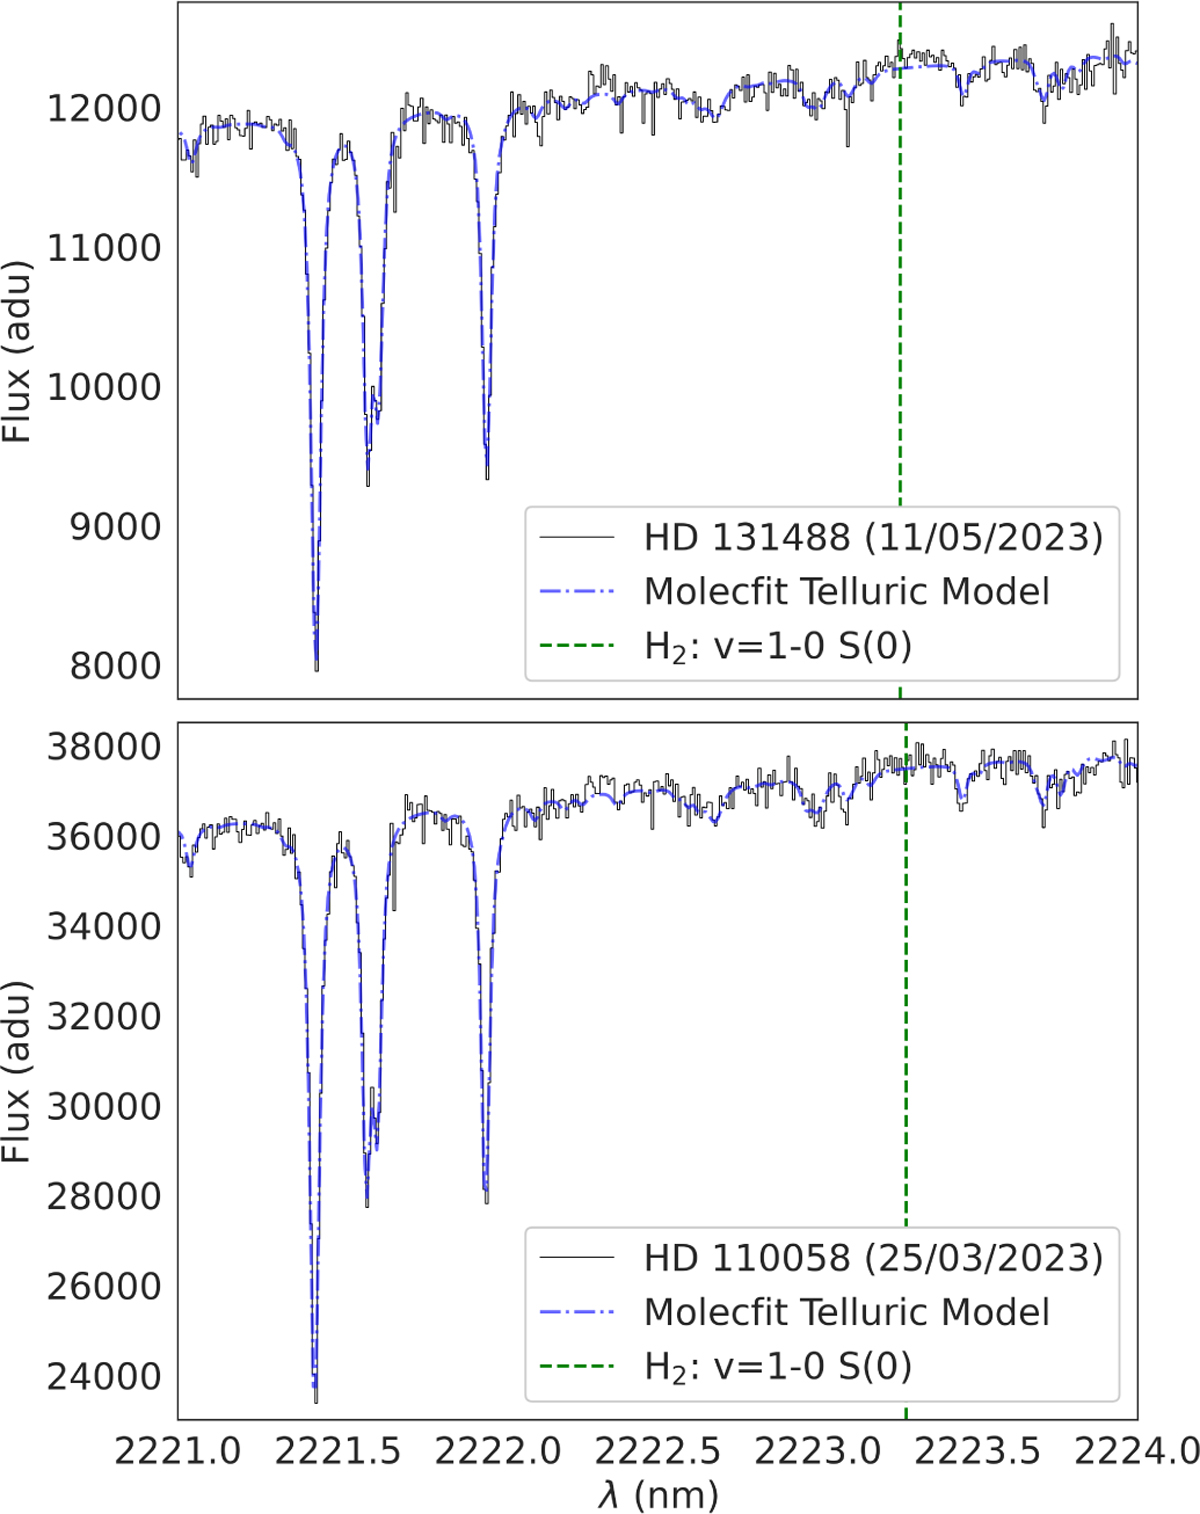
CRIRES+ spectra of HD 131488 and HD 110058 near the H2 v=1-0 S(0) line (black lines). In blue is the best-fit atmospheric transmission model from molecfit consisting of CH4 and H2 O absorption lines, combined with our (linear) best-fit continuum model. The vertical green line denotes the expected location of the H2 transition of interest.
Current usage metrics show cumulative count of Article Views (full-text article views including HTML views, PDF and ePub downloads, according to the available data) and Abstracts Views on Vision4Press platform.
Data correspond to usage on the plateform after 2015. The current usage metrics is available 48-96 hours after online publication and is updated daily on week days.
Initial download of the metrics may take a while.