Open Access
Fig. 4
Download original image
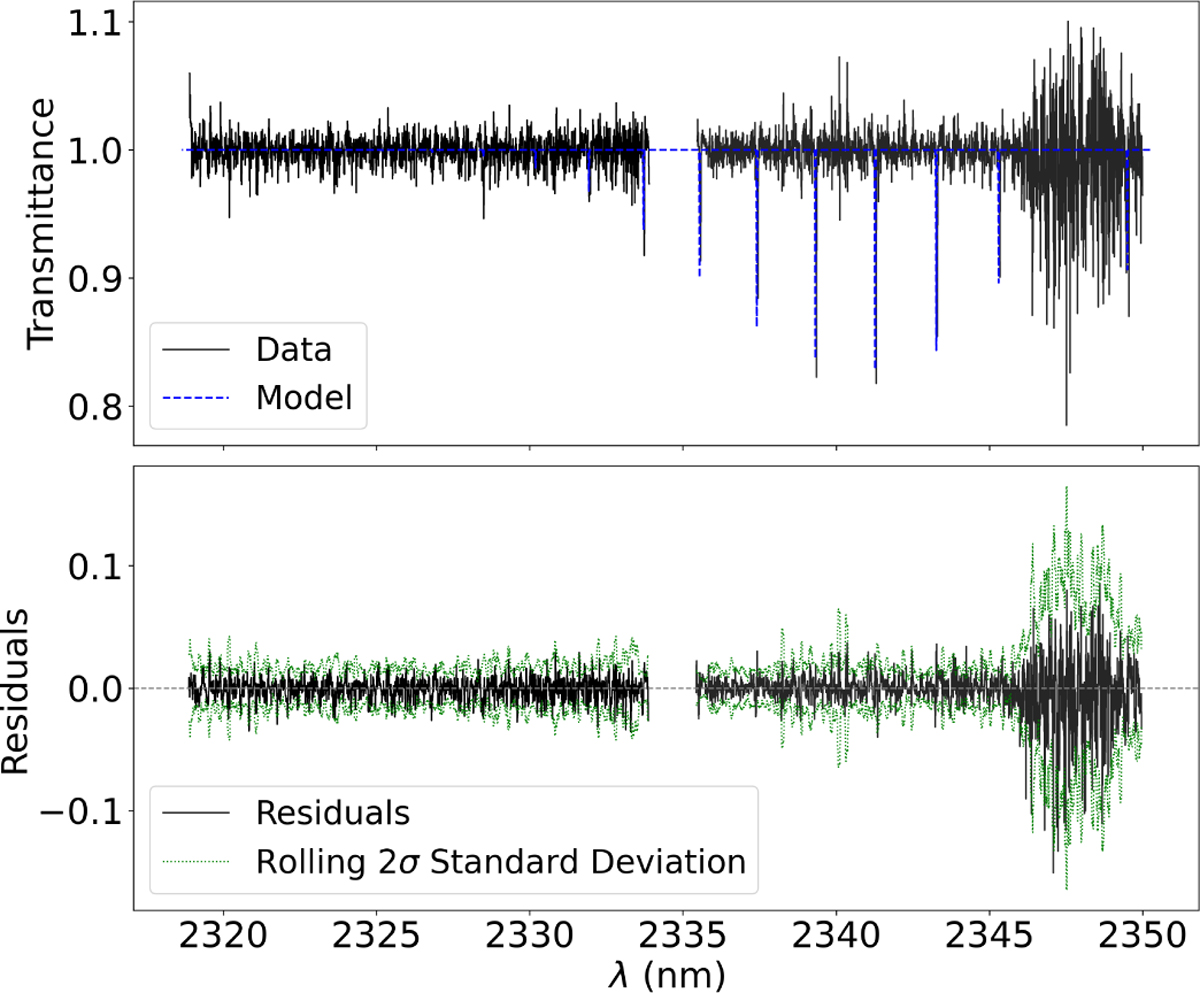
Best-fit (highest log posterior probability) 12CO models, normalised HD 131488 data, and residuals. Top: HD 131488 12CO data (solid black line) overlaid with the best-fit model (dotted blue line). Bottom: 12CO residuals (solid black line) and 2σ, calculated as twice the rolling standard deviation (dashed green line).
Current usage metrics show cumulative count of Article Views (full-text article views including HTML views, PDF and ePub downloads, according to the available data) and Abstracts Views on Vision4Press platform.
Data correspond to usage on the plateform after 2015. The current usage metrics is available 48-96 hours after online publication and is updated daily on week days.
Initial download of the metrics may take a while.