Fig. 9.
Download original image
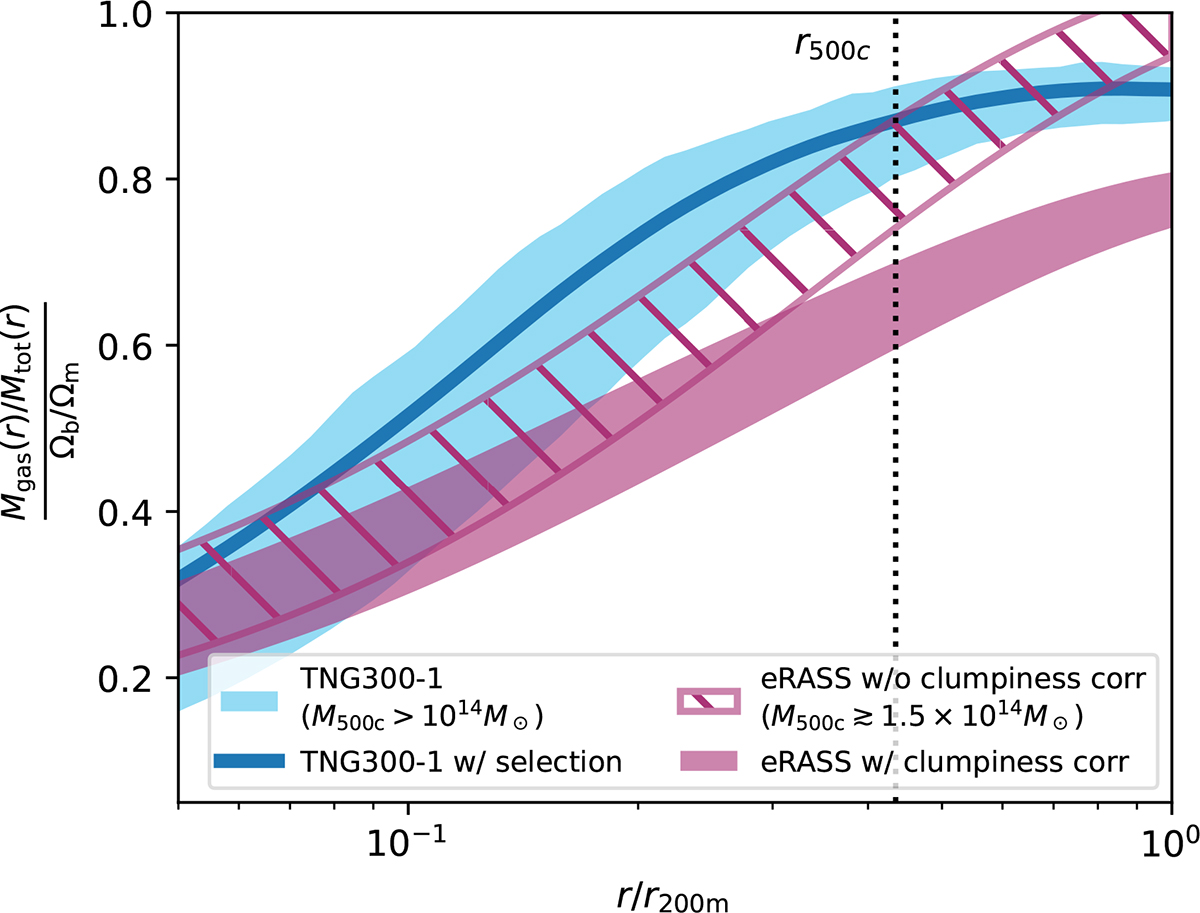
Measured eROSITA gas fraction profiles with respect to the cosmic baryon fraction up to r200m and the comparison with simulations. The observed profile from observation with and without residual clumpiness correction is plotted in the hatched and filled magenta bands, respectively. The bandwidth represents the uncertainty from halo concentration c200c assumptions of from 3 to 5. The 1σ scatter of gas fraction profiles of M500c > 1014 M⊙ halos in the TNG300-1 simulations is plotted in a blue band, and the averaged gas fraction of halos with the selection function applied is plotted in the thick blue line.
Current usage metrics show cumulative count of Article Views (full-text article views including HTML views, PDF and ePub downloads, according to the available data) and Abstracts Views on Vision4Press platform.
Data correspond to usage on the plateform after 2015. The current usage metrics is available 48-96 hours after online publication and is updated daily on week days.
Initial download of the metrics may take a while.