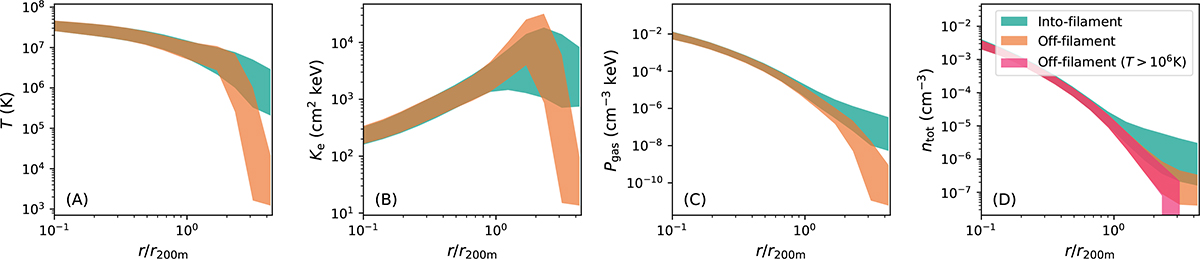
Fig. 8.
Download original image
One-σ scatter of the temperature (A), electron entropy (B), gas pressure (C), and gas density (D) line-of-sight profiles grouped into the filament (teal color) and off-filament directions (orange color) in the TNG300-1 simulations. All four profile types show a strong discrepancy in the two directions. In addition, we plot the T > 106 K gas density profile in the off-filament direction in magenta in panel D. The hot gas is confined by the accretion shock within 3 × r200m.
Current usage metrics show cumulative count of Article Views (full-text article views including HTML views, PDF and ePub downloads, according to the available data) and Abstracts Views on Vision4Press platform.
Data correspond to usage on the plateform after 2015. The current usage metrics is available 48-96 hours after online publication and is updated daily on week days.
Initial download of the metrics may take a while.