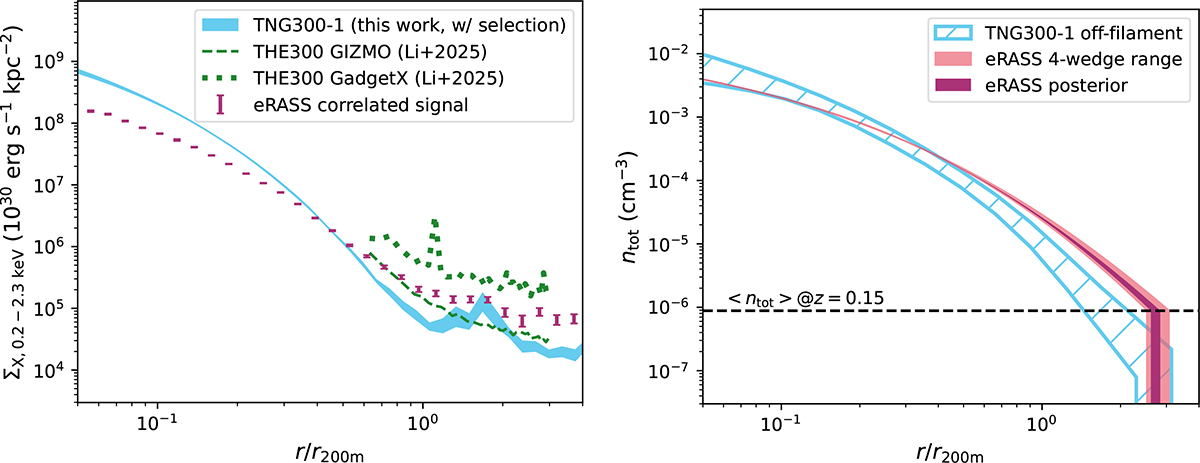
Fig. 7.
Download original image
Left: Comparison of the projected emission profiles from observations and simulations. The observed stacked eROSITA profile from this work is shown in purple error bars. The profiles extracted from the TNG300-1 simulation are shown as a cyan band. The TNG300-1 profile is more centrally peaked than the observed profile. For comparison, profiles of The Three Hundred Gizmo-Simba and Gadget-X simulations from Li et al. (2025) are shown as dashed and dotted green lines, respectively. Right: Best-fit gNFW gas number density profile 1σ posterior range (purple) and the range of individual fittings of the four wedges (red). We overplot the TNG300-1 gas number density profile in the off-filament directions (cyan-hatched region).
Current usage metrics show cumulative count of Article Views (full-text article views including HTML views, PDF and ePub downloads, according to the available data) and Abstracts Views on Vision4Press platform.
Data correspond to usage on the plateform after 2015. The current usage metrics is available 48-96 hours after online publication and is updated daily on week days.
Initial download of the metrics may take a while.