Fig. 6.
Download original image
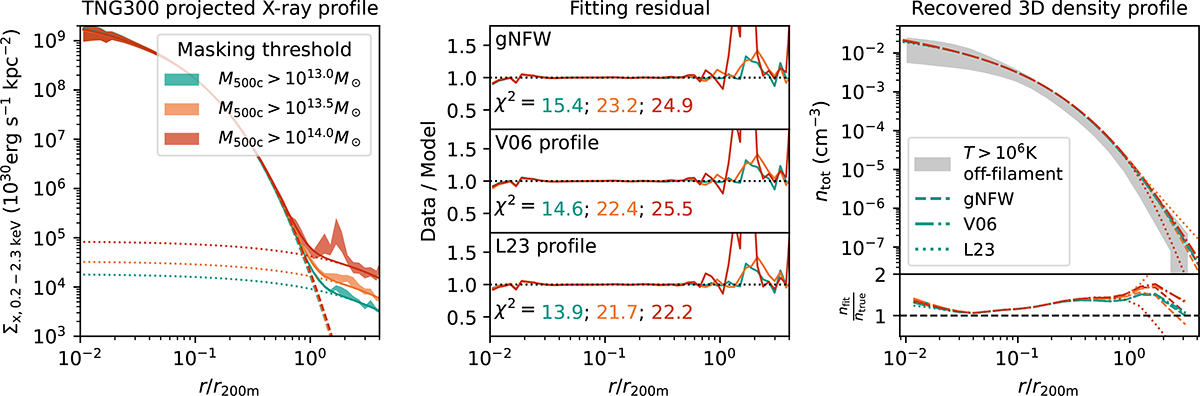
Left: Stacked surface X-ray emission profiles of the TNG300-1 galaxy cluster halos. The teal, orange, and red colors denote the nearby-halos masking thresholds of 1013, 1013.5, and 1014 M⊙, respectively. The shaded regions represent the bootstrapped uncertainties, reflecting the sample scatter. The best-fit gNFW profiles, the two-halo terms, and the total profiles are plotted as dashed, dotted, and solid lines, respectively. The sharp peaks in the outer profile are contributed to by bright nearby halos that are below the masking threshold. Middle: The residuals of the fittings of the three different one-halo models. The χ2 values for each fit are labeled. Right: The best-fit total number density profiles and their comparison to the T > 106 K gas density profile in the off-filament directions in 3D (see Sect. 4.3). Different colors denote the different nearby halo masking thresholds of the stacked profiles, as in the left and middle panels. The dashed, dash-dotted, and dotted lines denote the results of the gNFW, V06, and L23 models, respectively.
Current usage metrics show cumulative count of Article Views (full-text article views including HTML views, PDF and ePub downloads, according to the available data) and Abstracts Views on Vision4Press platform.
Data correspond to usage on the plateform after 2015. The current usage metrics is available 48-96 hours after online publication and is updated daily on week days.
Initial download of the metrics may take a while.