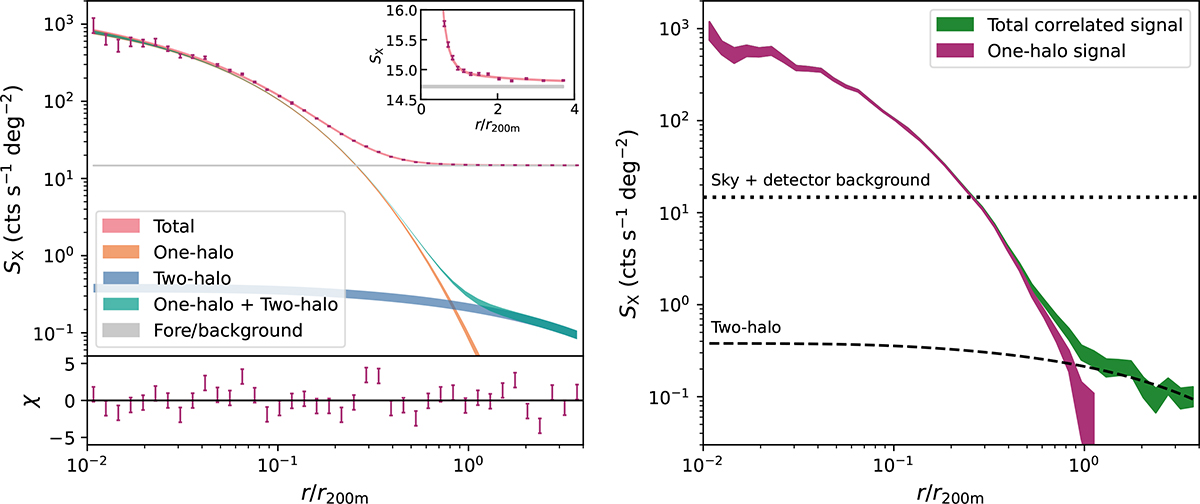
Fig. 4.
Download original image
Left: Best-fit results of the stacked 0.2–2.3 keV eROSITA surface brightness profile, where we adopted the gNFW model for the one-halo component. The width of each component denotes the 1σ scatter of the posterior samples. The inset shows a zoomed-in view around the background level. Right: Surface brightness profiles of the background-subtracted correlated signal (green) and the one-halo term signal. The systematic uncertainties of the uncorrelated background and the fitting uncertainties of the constant model and two-halo term normalization were propagated when calculating the profile uncertainty.
Current usage metrics show cumulative count of Article Views (full-text article views including HTML views, PDF and ePub downloads, according to the available data) and Abstracts Views on Vision4Press platform.
Data correspond to usage on the plateform after 2015. The current usage metrics is available 48-96 hours after online publication and is updated daily on week days.
Initial download of the metrics may take a while.