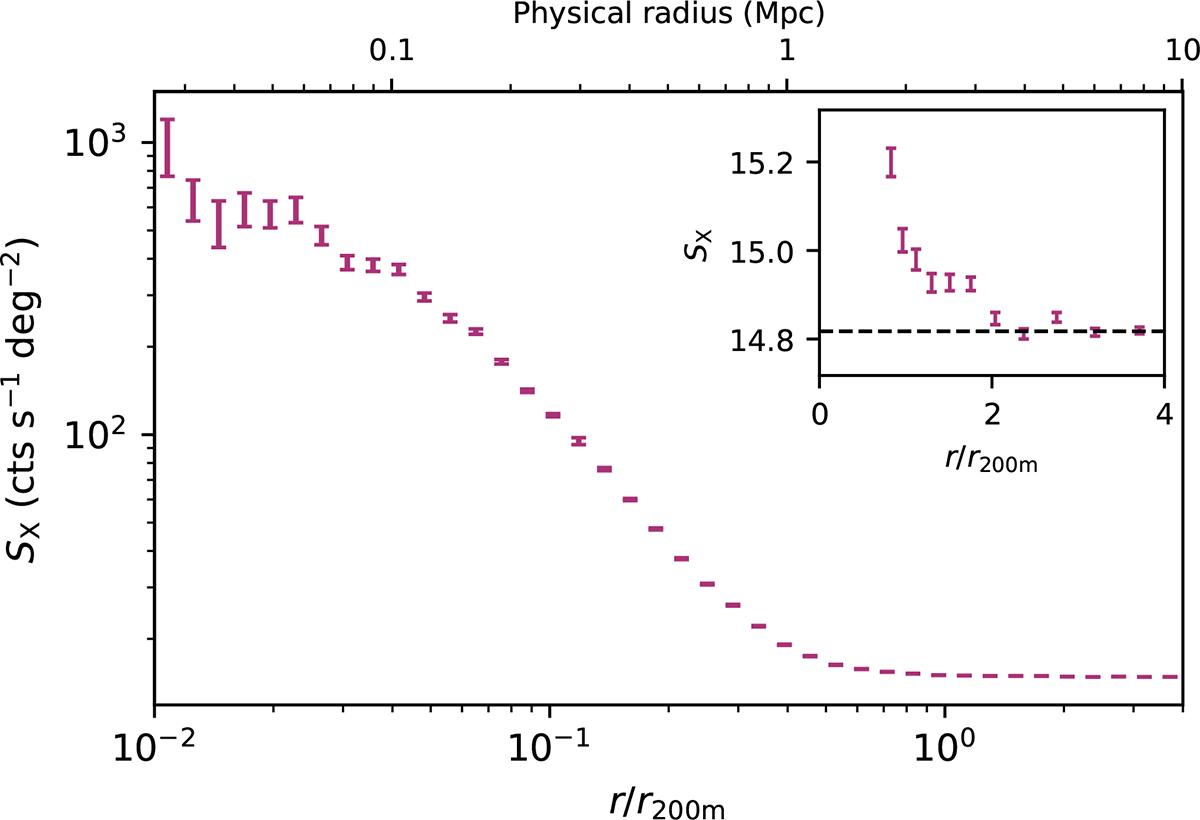
Fig. 3.
Download original image
Stacked eROSITA surface brightness profile in the 0.2–2.3 keV band after the stray light component was removed. The radial distance to the cluster center is scaled to the overdensity radius r200m. The corresponding physical radius given the sample median mass and redshift is labeled at the top of the figure. The top-right inset provides a zoomed-in view of the profile within a zoomed surface brightness range around the background level, with the dashed horizontal line indicating the average surface brightness between 3 and 4 r200m. The profile shows significant X-ray emission extended to approximately 2 × r200m.
Current usage metrics show cumulative count of Article Views (full-text article views including HTML views, PDF and ePub downloads, according to the available data) and Abstracts Views on Vision4Press platform.
Data correspond to usage on the plateform after 2015. The current usage metrics is available 48-96 hours after online publication and is updated daily on week days.
Initial download of the metrics may take a while.