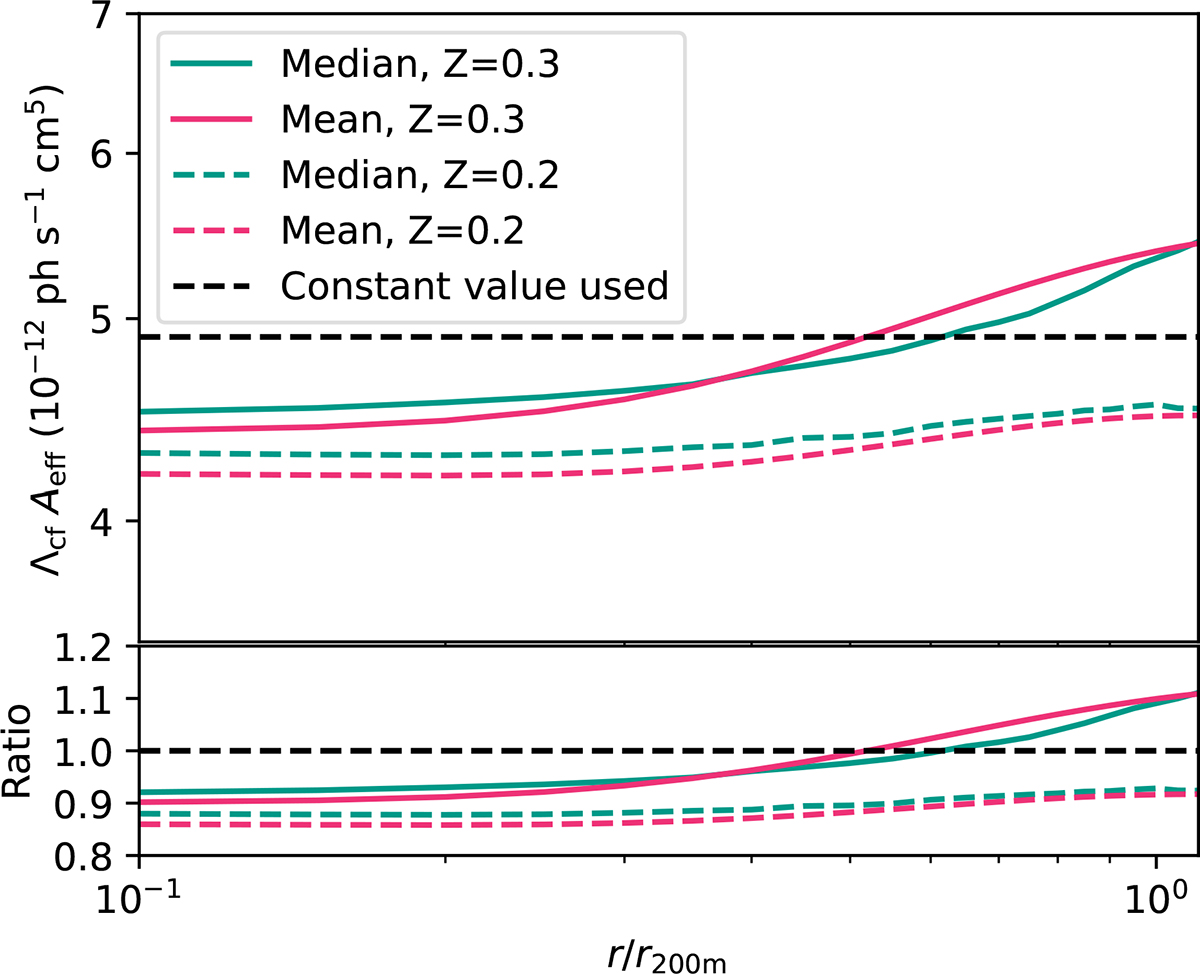
Fig. C.1.
Download original image
Top: Sample averaged (teal) and median (red) radial cooling functions that take individual cluster temperature profiles and foreground absorption strength into account. Solid and dashed lines denote metallicity assumptions of 0.3 and 0.2 Z⊙, respectively. The black-dashed line represents the constant cooling function used for model fitting in this work. Bottom: Ratios between radial cooling functions and the constant value used for model fitting.
Current usage metrics show cumulative count of Article Views (full-text article views including HTML views, PDF and ePub downloads, according to the available data) and Abstracts Views on Vision4Press platform.
Data correspond to usage on the plateform after 2015. The current usage metrics is available 48-96 hours after online publication and is updated daily on week days.
Initial download of the metrics may take a while.