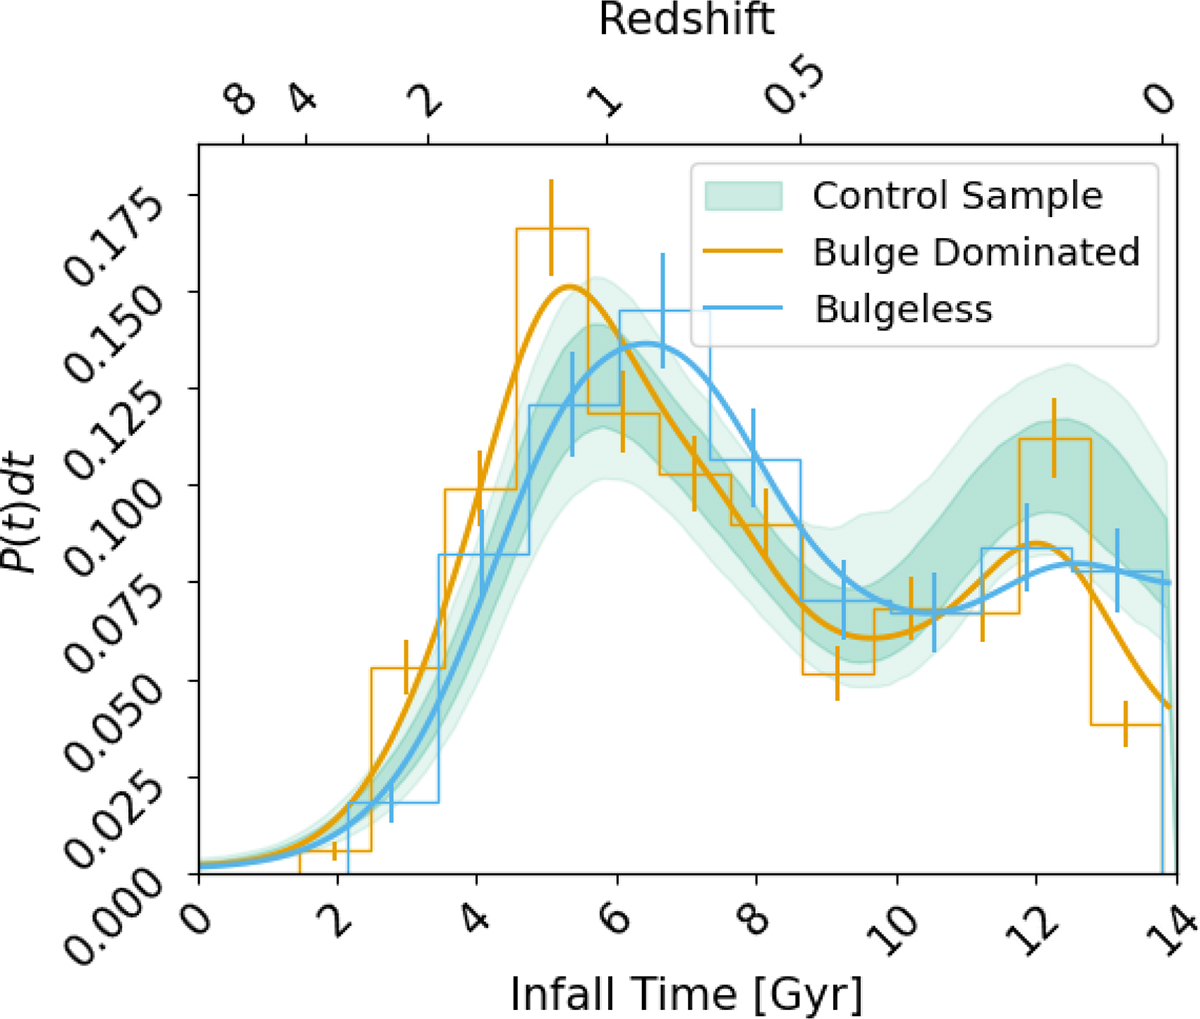
Fig. 9.
Download original image
Satellite infall time distribution. Infall times are estimated as the first moment the satellite lies within R200 of its host. BL in blue, BD in orange, and CS in green. Histogram error bars indicate 1σ Poisson scatter. Solid lines are KDE estimates of their respective distributions. Shaded bands in the CS indicate to the 1σ and 2σ regions over the 1000 realisations.
Current usage metrics show cumulative count of Article Views (full-text article views including HTML views, PDF and ePub downloads, according to the available data) and Abstracts Views on Vision4Press platform.
Data correspond to usage on the plateform after 2015. The current usage metrics is available 48-96 hours after online publication and is updated daily on week days.
Initial download of the metrics may take a while.