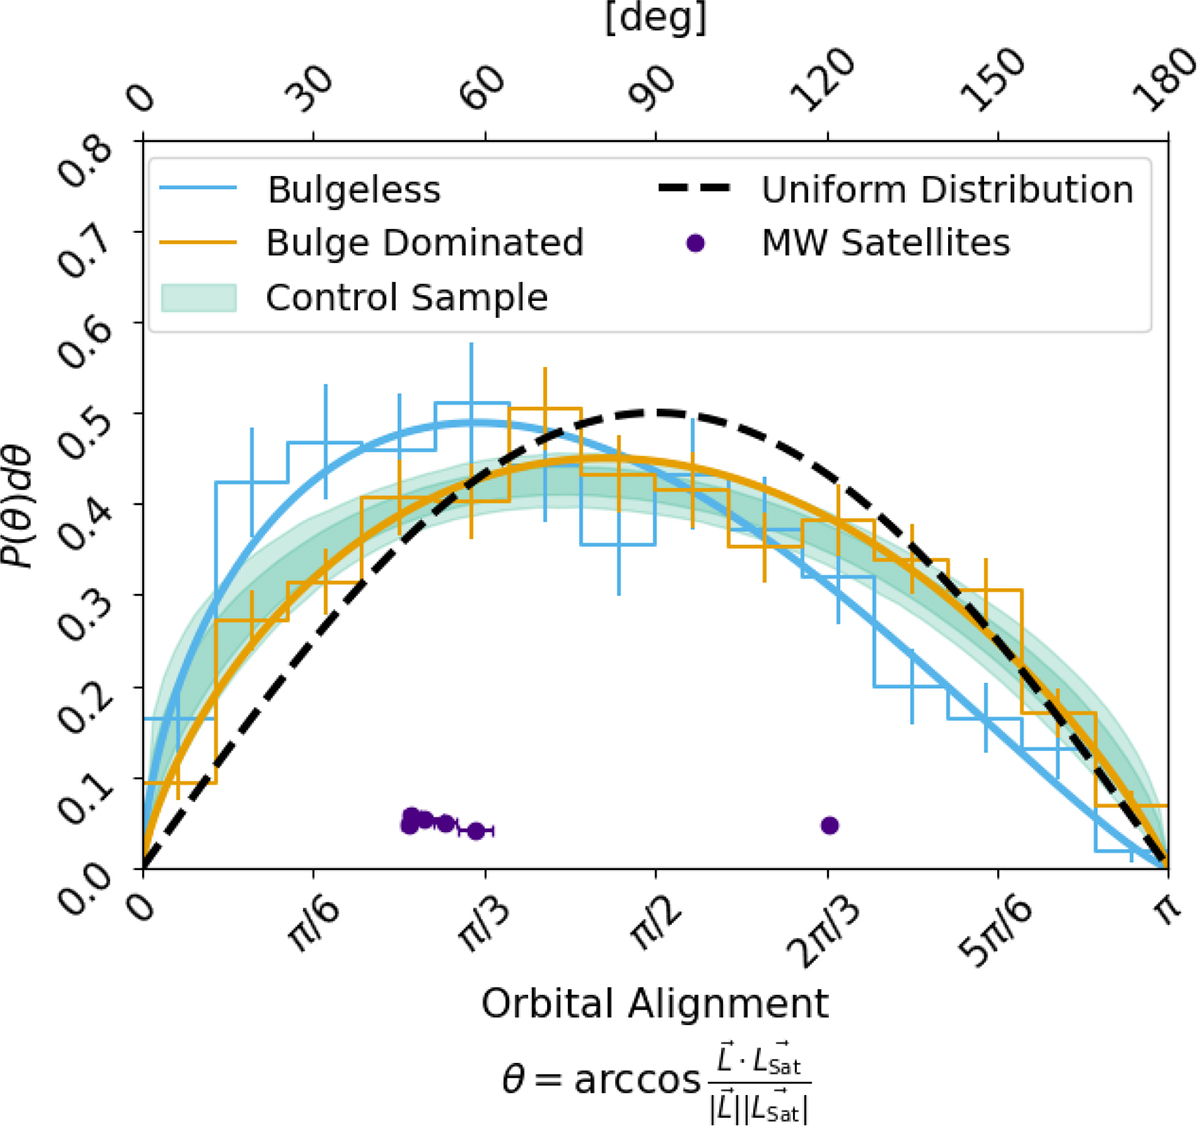
Fig. 8.
Download original image
Distribution of satellite orbital alignment with respect to host stellar angular momentum computed within 1 half mass radius at z = 0. BL in blue, BD in orange, and CS in green. Error bars in the histogram indicate 1σ Poisson scatter. Solid thick lines show a best fit to a beta distribution. Green band indicates the 1σ and 2σ interval of the best fitted beta distribution to the 1000 realisations of the CS. The black dashed line indicates what we would expect from an isotropic distribution of satellite orbits We include for comparison the orbital orientation of MW satellites (indigo dots) obtained from the Pace (2025) dataset. Note that for visual purposes we have added random vertical offset to each satellite.
Current usage metrics show cumulative count of Article Views (full-text article views including HTML views, PDF and ePub downloads, according to the available data) and Abstracts Views on Vision4Press platform.
Data correspond to usage on the plateform after 2015. The current usage metrics is available 48-96 hours after online publication and is updated daily on week days.
Initial download of the metrics may take a while.